Introduction
The goal of this project is to analyze the distribution of lies among the political figures and news sources in the U.S. and the effects of these lies on voters and social media. We use Liar dataset collected from PolitiFact.com and prepared by William Yang Wang [1]. We aim to specify the topics which politicians and news sources mostly lie about. We would like to emphasize the power of the statements made by notable sources in society.
Dataset
Dataset has information about the statements made by American politicians and it is in tab separated values format. It consists of three parts: training set, test set and validation set. In order to analyze as much data as we can, we merged all of them into a bigger dataset. After merging, we had a dataset with nearly 13000 entries.
| Id | Label | Statement | Subject | Speaker’s Job Title | Job | State | The Party Affiliation | barely true counts | false counts | half true counts | mostly true counts | pants on fire counts | Communication Media |
|---|---|---|---|---|---|---|---|---|---|---|---|---|---|
| 324.json | mostly-true | Hillary Clinton agrees with John McCain “by vo… | foreign-policy | barack-obama | President | Illinois | democrat | 70.0 | 71.0 | 160.0 | 163 | 9.0 | Denver |
- Id: This column contains the ID of the statement. It can be used in the following link http://www.politifact.com//api/v/2/statement/id?format=json to find the web article about the statement.
- Label: This column is the truth level of the statement. It can be one of these: barely-true, false, half-true, mostly-true, pants-fire and true.
- Statement: This column denotes the statement of the person.
- Subject: This column denotes the subjects in the statement.
- Speaker’s Job Title: Owner of the statement.
- Job: Job of the owner of the statement.
- State: U.S. state which the owner of the statement represents.
- The Party Affiliation: Political party of the owner of the statement.
- Counts: There are 5 different columns show the votes of the users of PolitiFact.com for the truth level of the statement.
- Barely true counts
- False counts
- Half true counts
- Mostly true counts
- Pants on fire counts
- Communication Media: Where the statement was made.
We also added Date column by extracting the information from the web article using Id column of the dataset, since we need the date of the statement for historical analysis.
Analysis of False Statements
We prepared some research questions to analyze the underlying structure of false statements. We also considered the effects of false statements on society.
Subjects that the politicians and news sources mostly lie about
We consider that a statement is a lie if it is labelled as false or pants-fire. We get the counts of subjects for every label type. Results can be seen below.

We observe that politicians and news sources lie mostly about health-care, taxes and economy. Candidates-biographies, unsurprisingly, are a common thing to lie about.
The most frequent words used in lies
We count the words in the statements for false and pants-fire category. First, we get the counts of words in the statements for each target value. Then, we get the counts of words in pants-fire and false statements to determine the words are the most common in lies. Most of the words are stop words and meaningless for analysis, but we need specific keywords. We get rid of stop words and try to reveal the relevant words for analysis. We use NLTK library to remove irrelevant words.


We observe that the Former U.S. President Barack Obama’s name are the most common word in false and pants-fire statements. Also, health-care and tax are very common words in lies. One of the interesting things in this dataset is that the word count of Wisconsin in lies is substantial. We can deduce that there are a lot of lies specifically told in Wisconsin or about Wisconsin. Finally, we can see that Obamacare is among the most common words in lies list. We think that people against this health reform told considerable amount of lies about this subject.
Total number of lies told by representers from each state
We count the number of false and pants-fire statements made by each state representers. Also, in order to remove places which are not a state of United States, we maintain a list of state names of United States.

We can see that the top 5 state which have the largest number of lie statements are Texas, Wisconsin, Florida, New York and Virginia. We can deduce that since Texas and New York are among the largest states of United States, the number of representers in these states are high unsurprisingly. However, although Wisconsin is a small state, it has a huge number of lies interestingly. It means that state representers in Wisconsin loves lying. We show the number of lies told by each state representers in a bar chart below. Also we show the results in a map.
What are the most frequent words that used in lies relating to specific subjects?
Health care
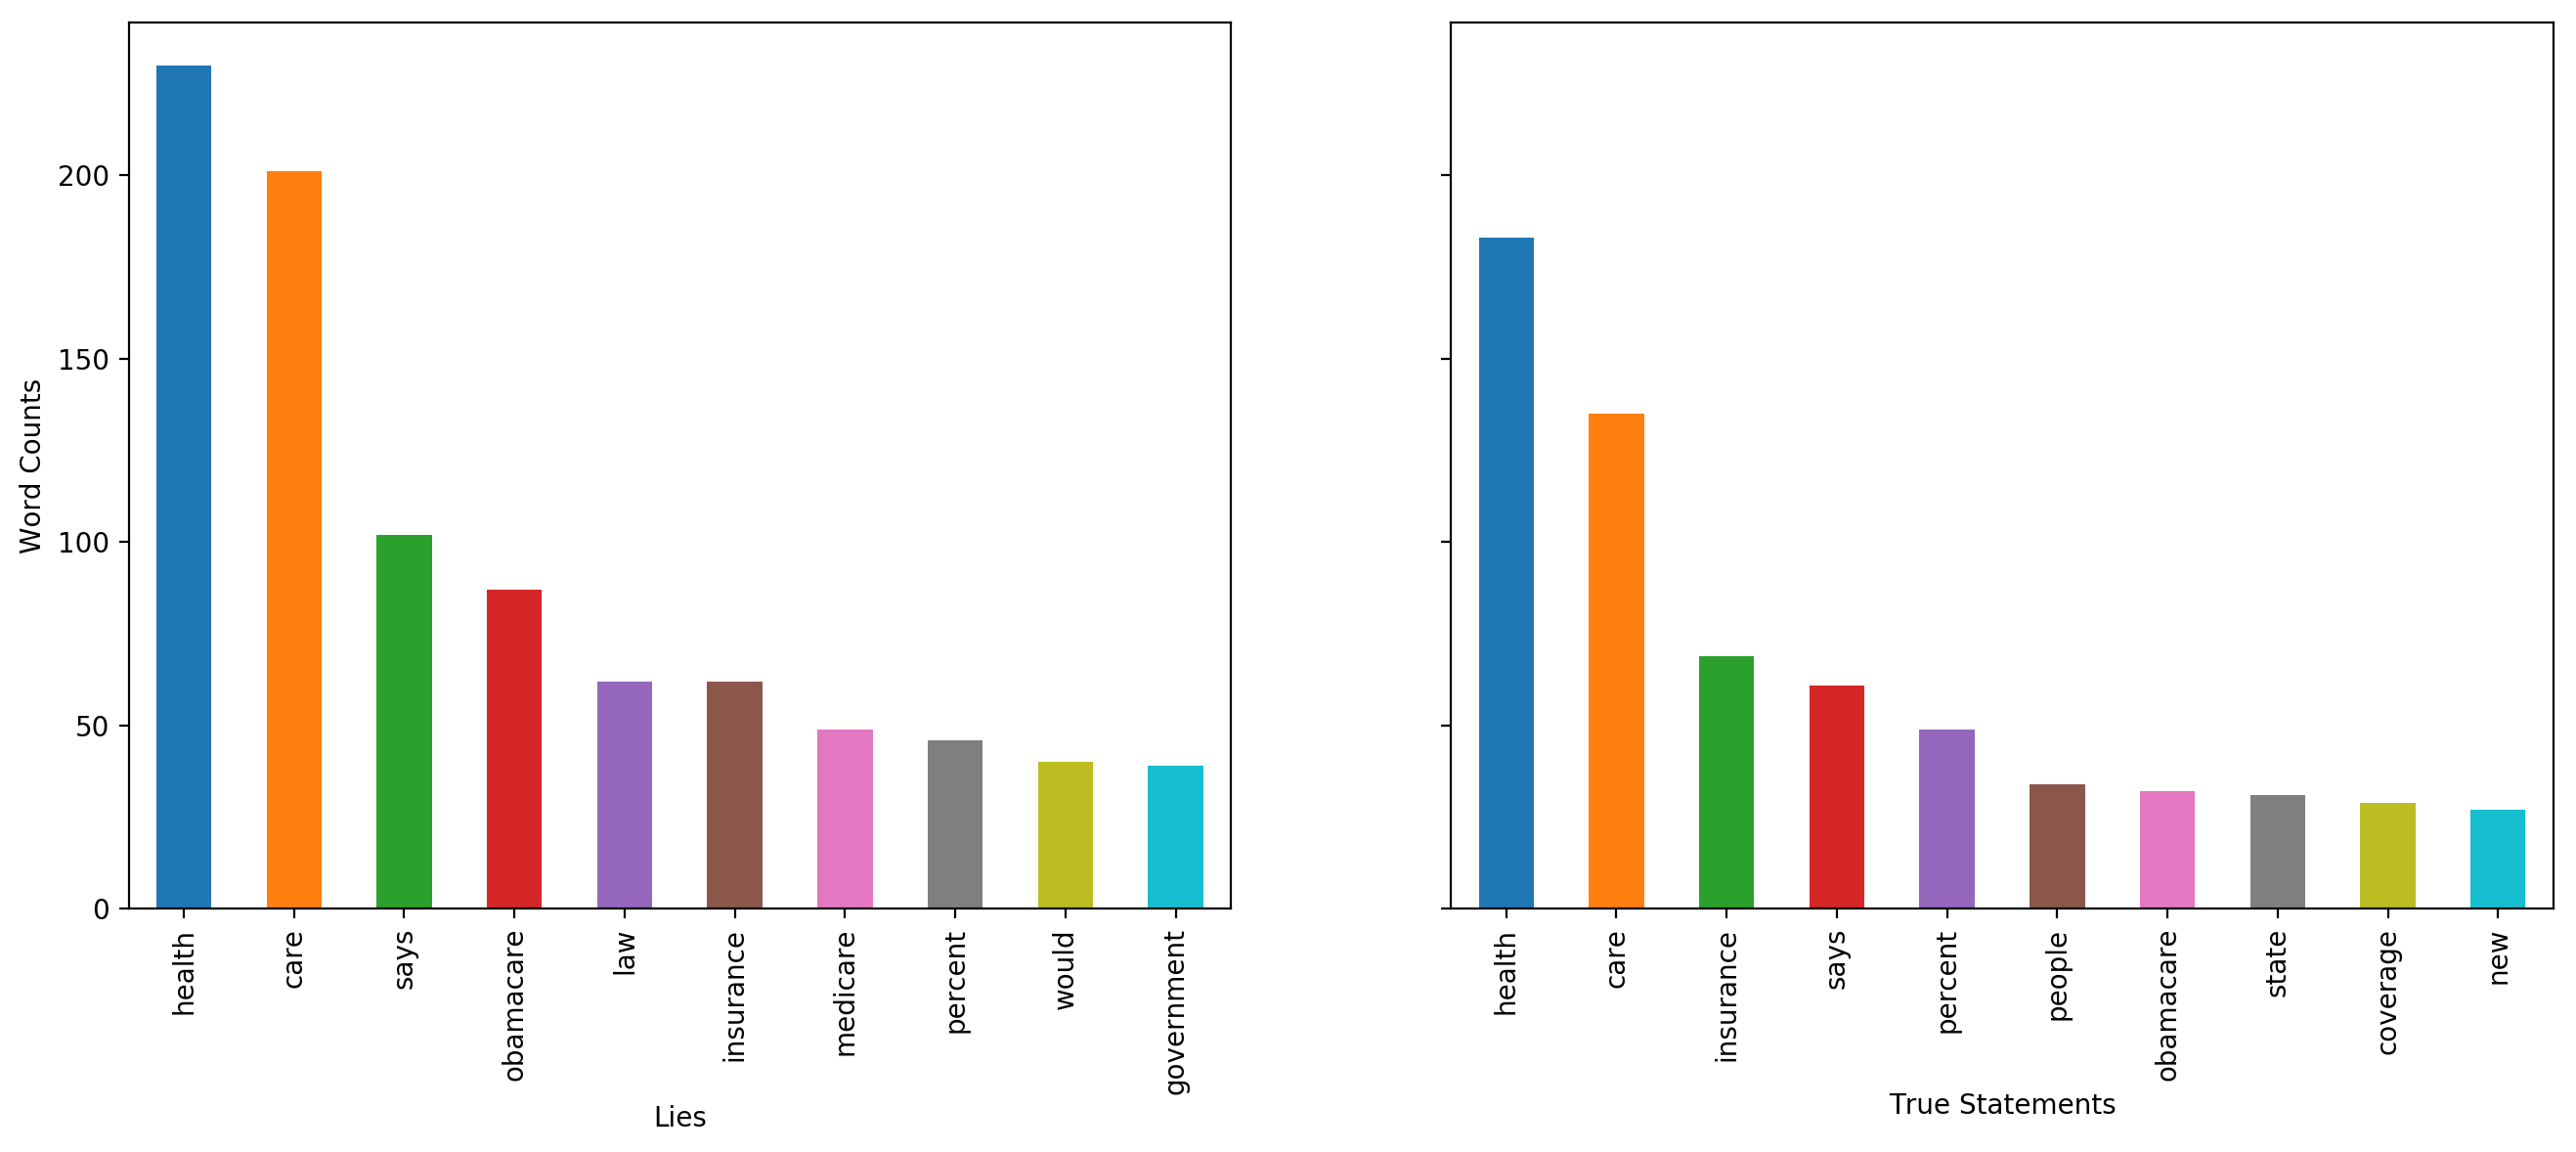
When top 10 frequent words related to health-care are analyzed for lies and truths, it is found that some words in lies are not found in top words of truths. These words are ‘law’, ‘medicare’, ‘would’ and ‘government’. We also observed that ranks of some words in lies precede their ranks in truths. These words are ‘says’ and ‘obamacare’.
Tax
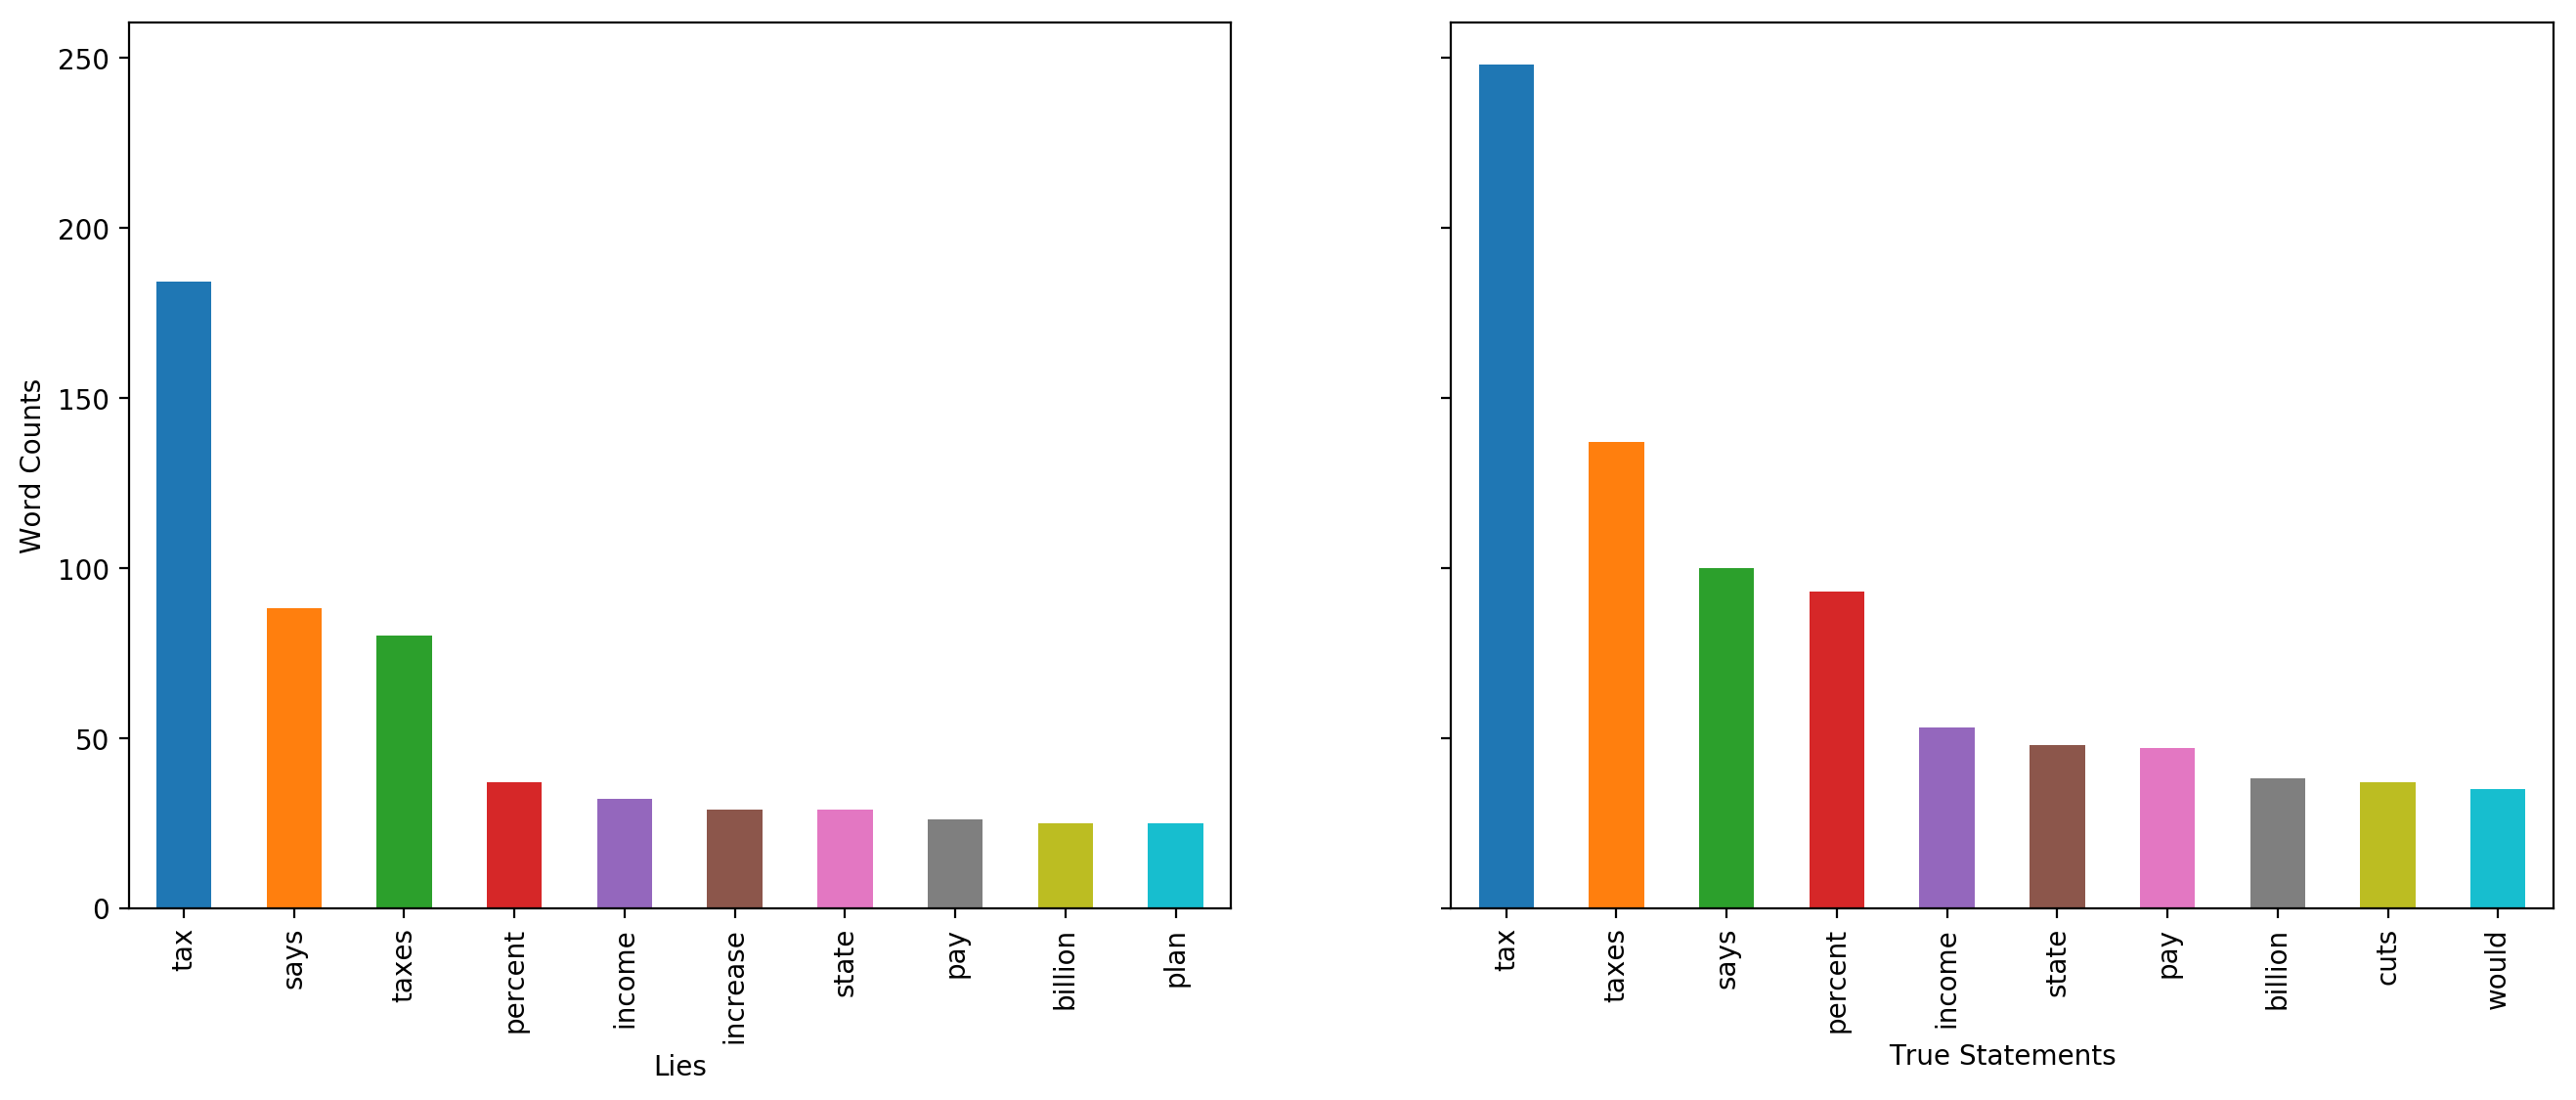
10 frequent words related to taxes are analyzed for lies and truths, it is found that only one word in lies is not found in top words of truths. It is ‘increase’. We also observed that ranks of no words in lies precedes its rank in truths.
Economy
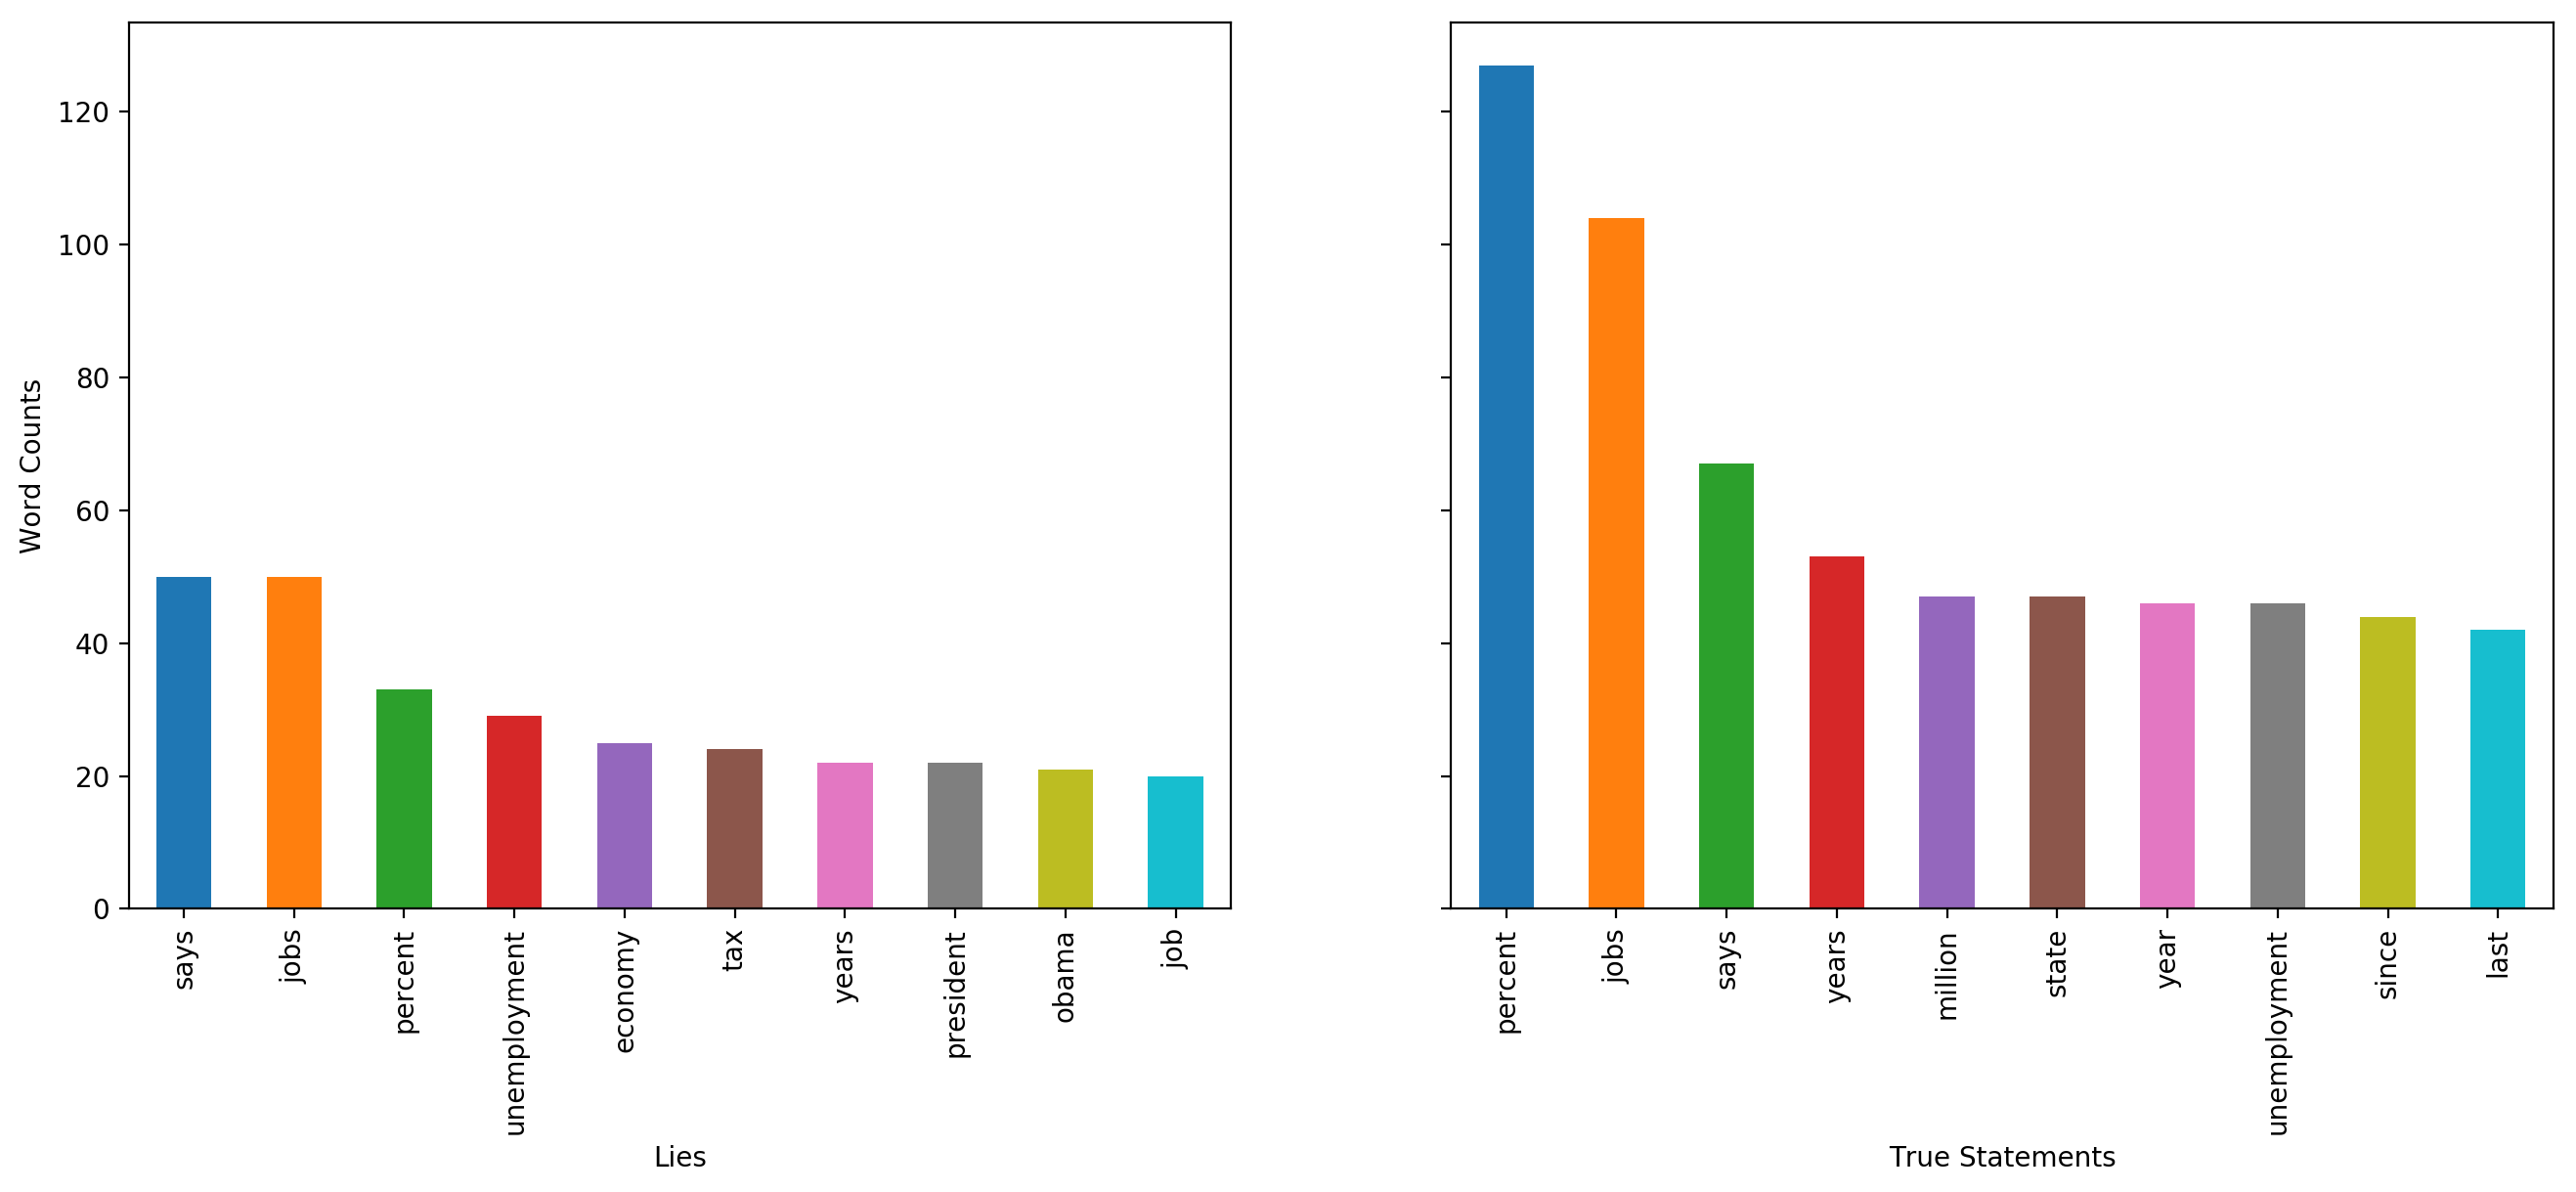
In 10 most frequent words related to ecomony analyzed for lies and truths, we observed that some words in lies are not found in top words of truths. These words are ‘tax’, ‘president’, ‘obama’ and ‘people’. We also observed that ranks of some words in lies precede their rank in truths. These words are ‘says’, ‘economy’ and ‘unemployment’.
Immigration
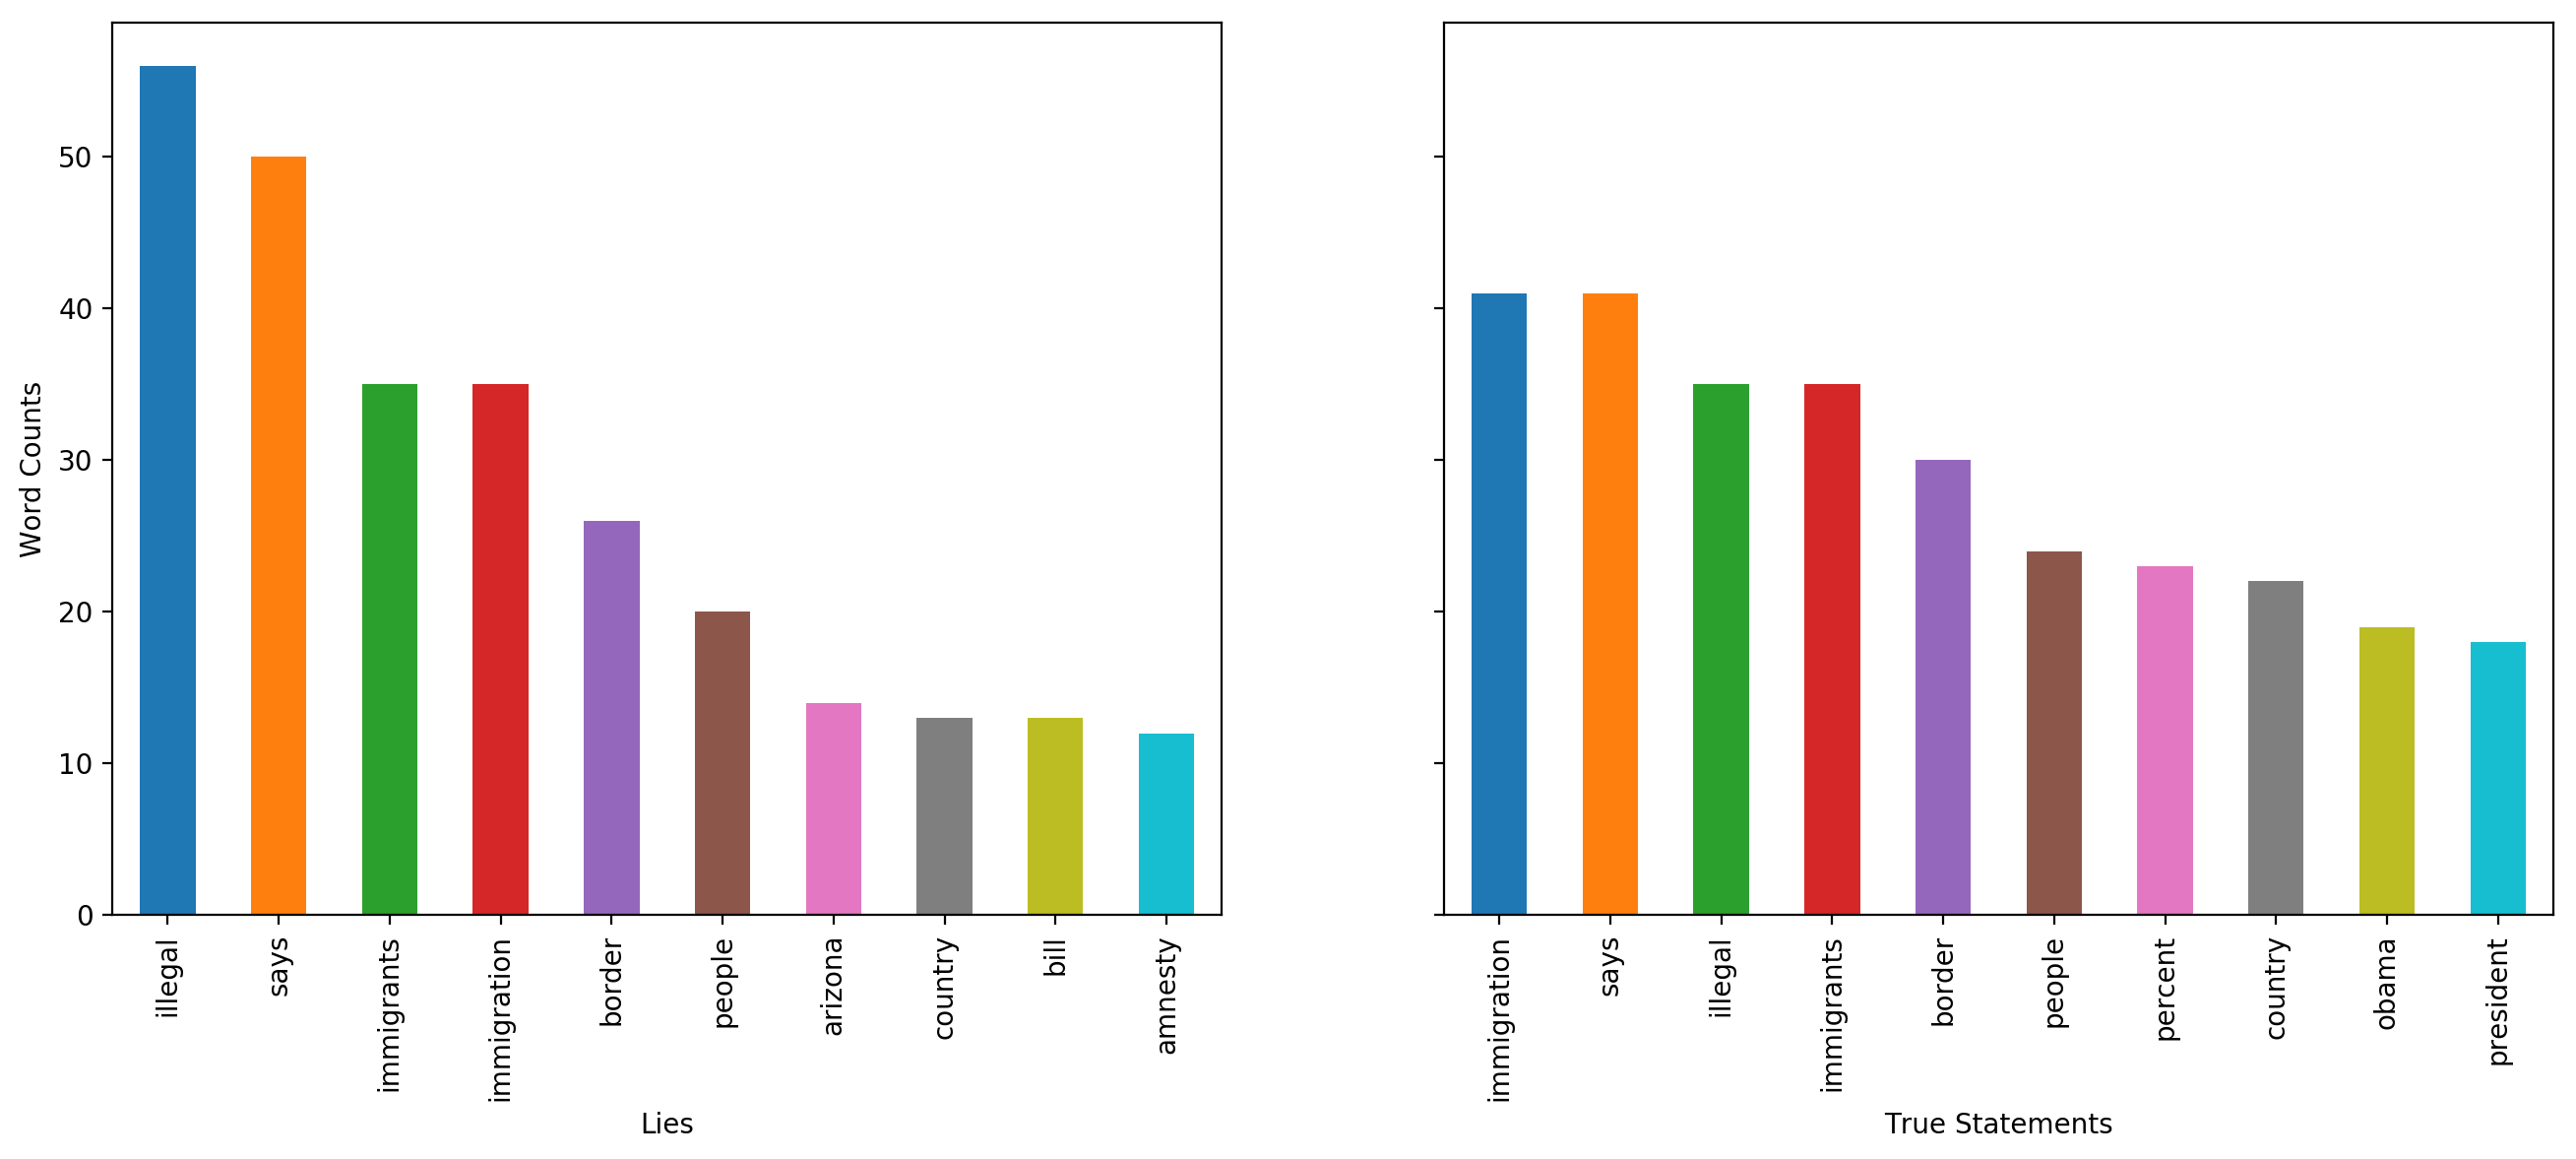
When top 10 frequent words related to immigration are analyzed for lies and truths, we observed that some words in lies are not found in top words of truths. These words are ‘arizona’, ‘bill’, and ‘voted’. It is also observed that ranks of some words in lies precede their rank in truths. These words are ‘illegal’, and ‘immigrants.
Overall, it can be deduced that top words in both lies and truths are the words related to the category and therefore expected. Even though there are difference of ranks in top words of lies and truths, this difference is not enough to deduce that a sentence with a given word has a higher chance of being true or a lie.
Do republicans and democrats tell lies more in the states that they won or they lost?
In this research question, we aim to reveal if lying during election campaign works well for both parties. We will ask the question: “Did both parties win the states that they lie more during election campaign?”
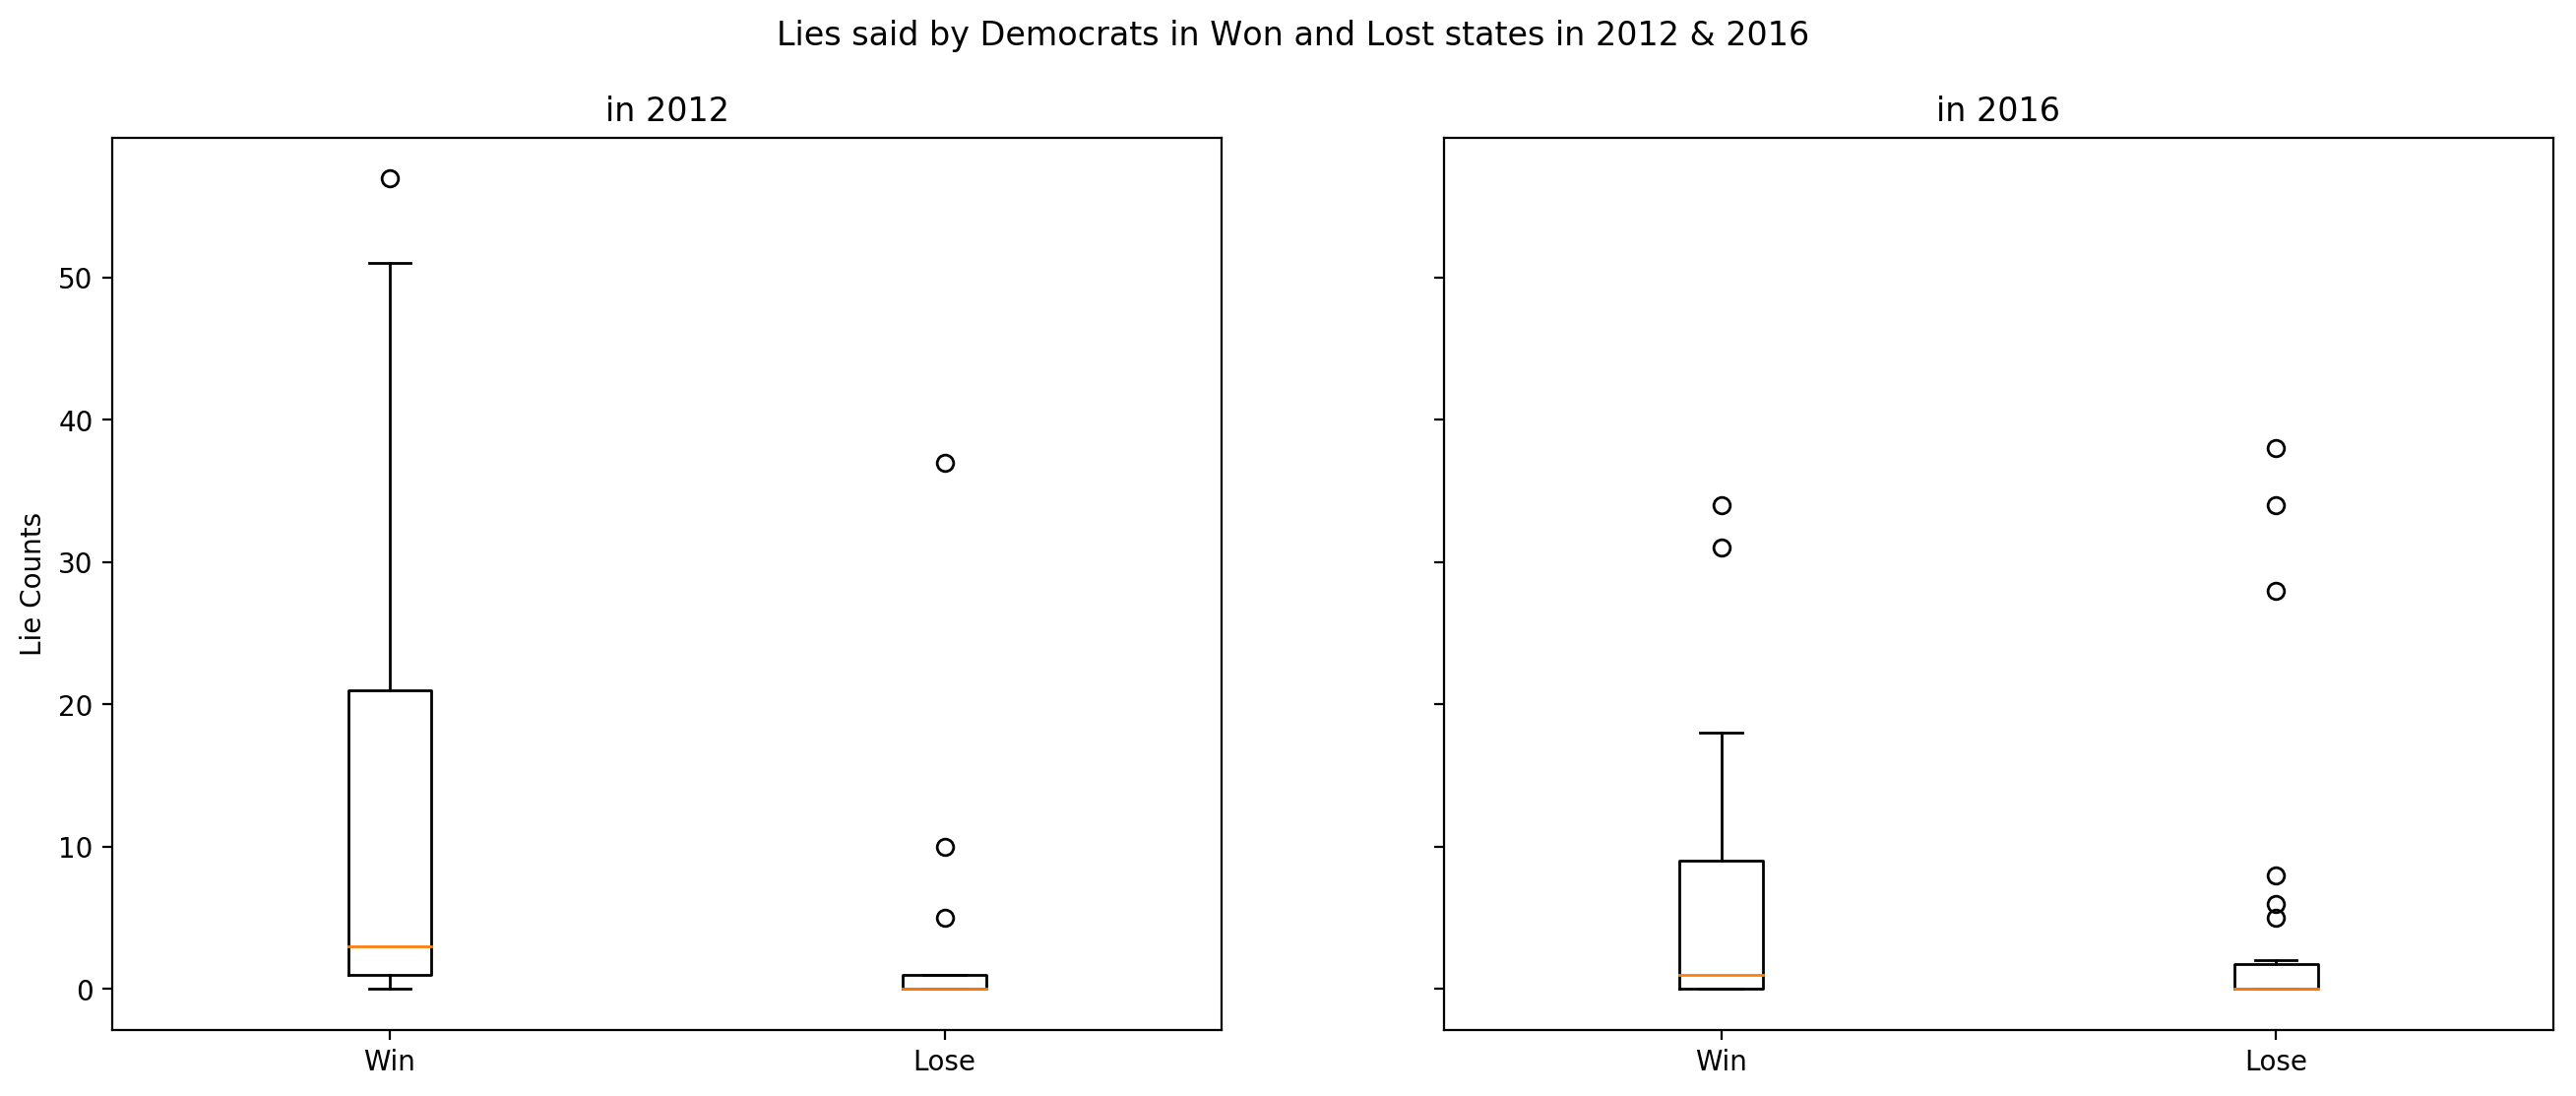
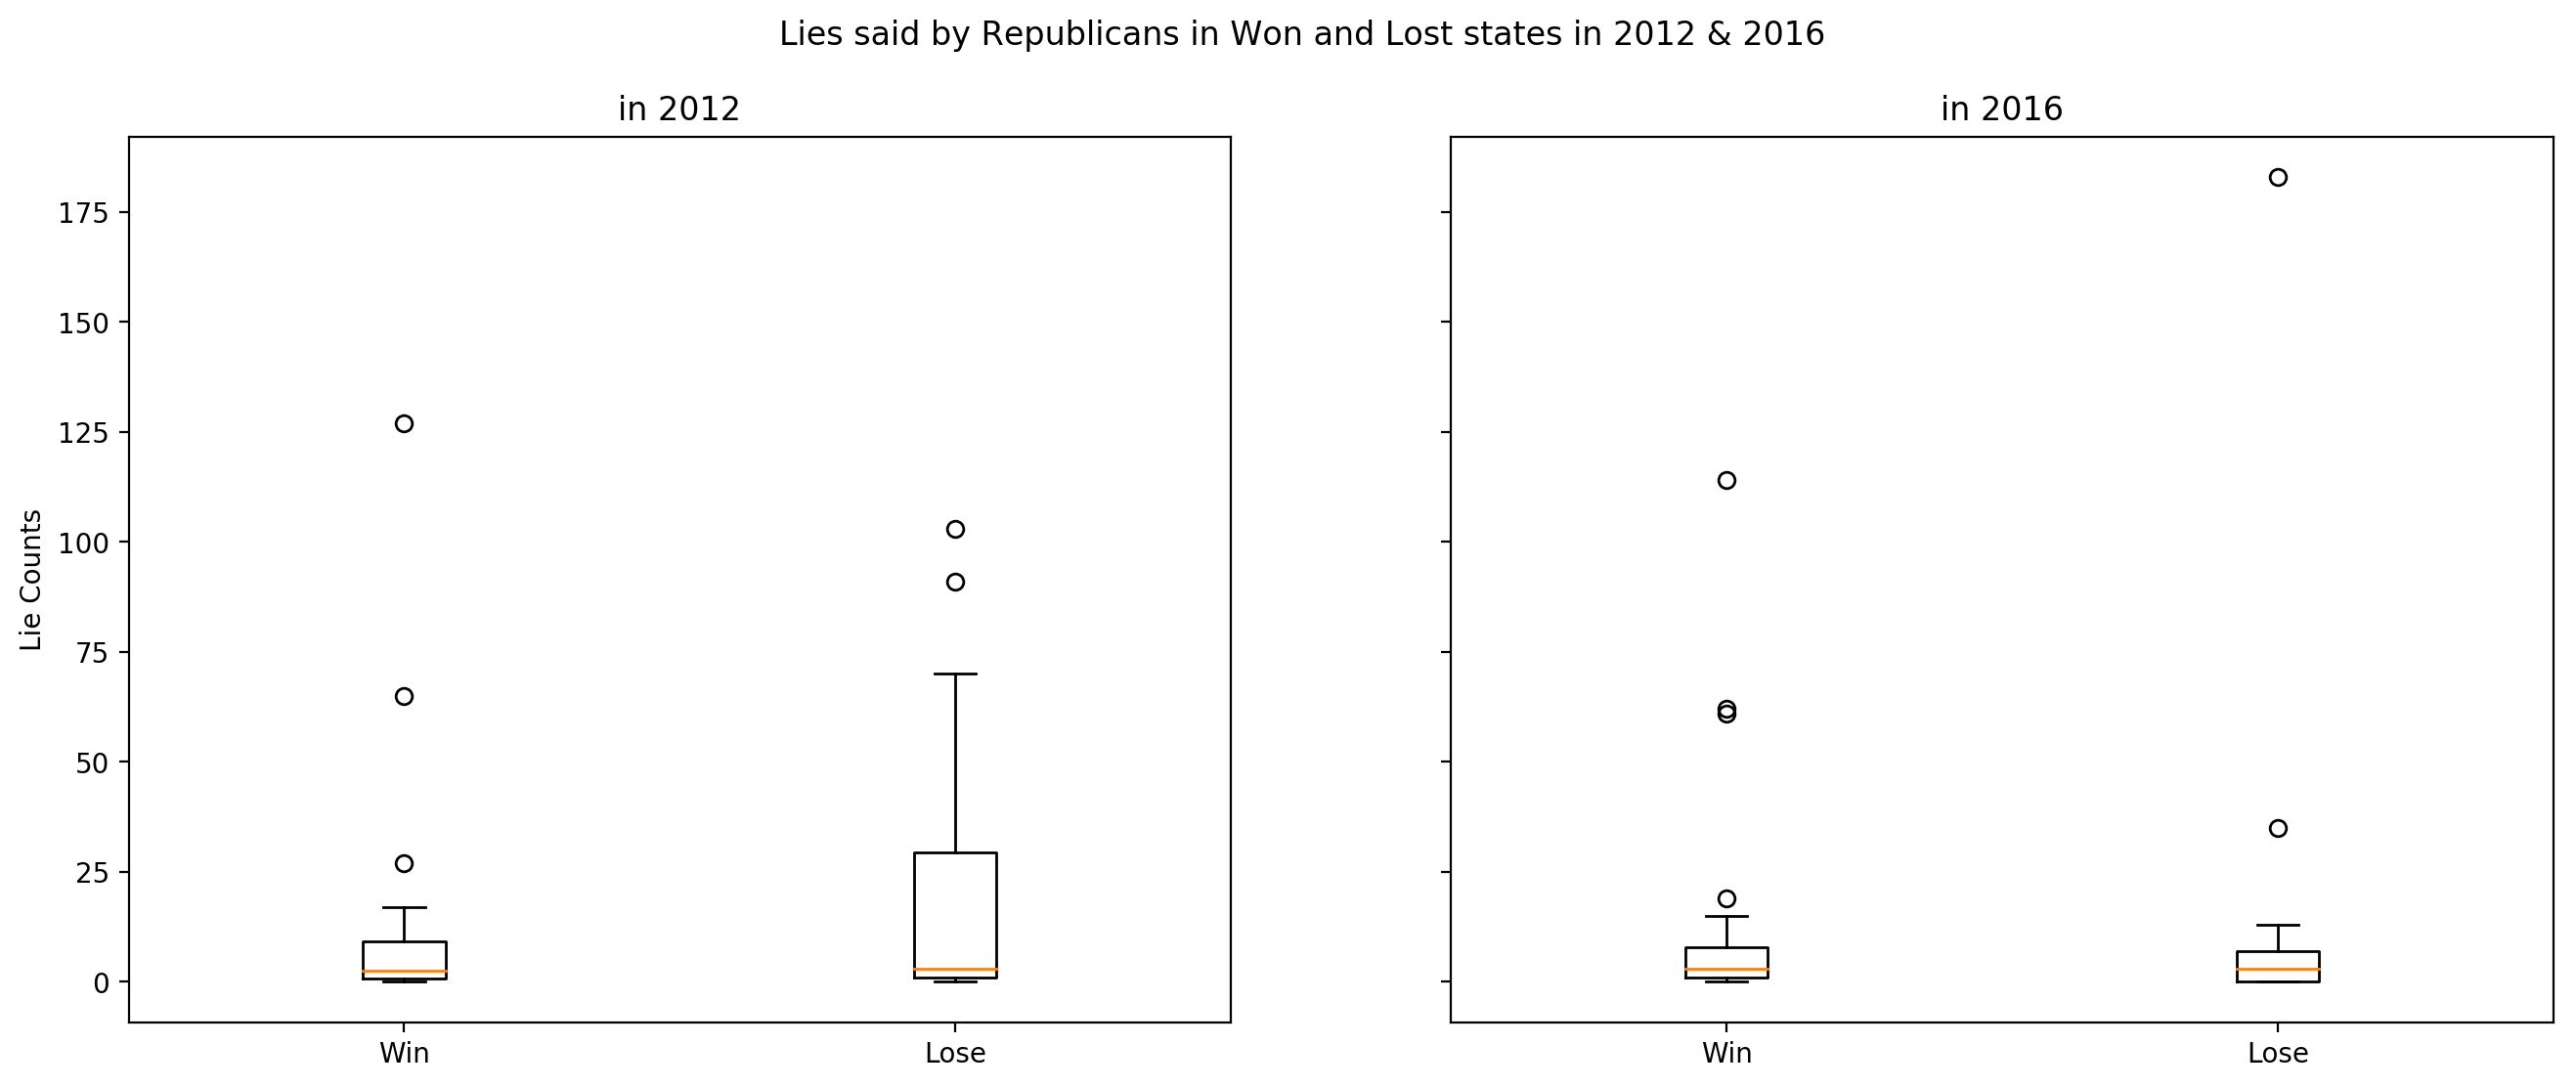
We determined the number of lies said by democrats and republicans in the states where they won and lost in 2012 and 2016. Lies are collected starting from the previous election until the election year. For example for year 2012, the lies between 2008 and 2012 are used.
We compared the means of lies in the states that Republicans and Democrats win and the states that they lose in 2012 and 2016 elections in order to determine in which type of states that they lie more.
| Democrats | Mean | Std Dev. |
|---|---|---|
| 2012-Win | 12.25 | 17.6 |
| 2012-Lose | 2.37 | 7.69 |
| 2016-Win | 6.42 | 10.14 |
| 2016-Lose | 4.30 | 10.11 |
In 2012, there is a significant difference between number of lies in won and lost states. In, 2016, the difference is not so significant.
| Republicans | Mean | Std Dev. |
|---|---|---|
| 2012-Win | 12.5 | 28.11 |
| 2012-Lose | 19.66 | 28.77 |
| 2016-Win | 11.73 | 24.62 |
| 2016-Lose | 13.85 | 39.53 |
Since the standard deviation of the lie samples for both types of states have unequal variances and unequal sample sizes, we decide to use Welch’s T-Test to compare means of the samples. We select the significance level as 0.05.
Lies told by Democrats in Won and Lost states 2012 & 2016
| statistics | p-val | |
|---|---|---|
| 2012 | 2.646 | 0.011 |
| 2016 | 0.738 | 0.464 |
According to Welch T-test on 2012 data, p-value is below significance level of 0.05. It means that the mean of the lie counts is significantly higher in states that Democrats win than the states that they lose in 2012 elections.
In 2016 data, p-value is above significance level of 0.05. It means that we can not reject the null hypothesis which state that there is no significant difference between the means of counts sample in Democrats’ win states and lost states in 2016 elections.
Lies told by Republicans in Won and Lost states 2012 & 2016
| statistics | p-val | |
|---|---|---|
| 2012 | -0.898 | 0.373 |
| 2016 | -0.218 | 0.828 |
According to Welch T-test on 2012 data, p-value is above significance level of 0.05. It means that we cannot reject the null hypothesis which state that there is no significant difference between the means of counts sample in Republicans’ win states and lost states in 2012 elections.
In 2016 data, p-value is above significance level of 0.05. It means that we cannot reject the null hypothesis which state that there is no significant difference between the means of counts sample in Republicans’ win states and lost states in 2016 elections.
Visualization of the truth ratios of the statements made by famous politicians
We consider that a statement is a lie if it is labelled as false or pants-fire. We create the counts of subjects for each label category. We pick Barack Obama, Donald Trump and Hillary Clinton, because during 2016 Elections campaign, most of the statements were made by these three figures and also these people were well known all over the world compared to other politicians in the dataset.

We can observe that the statement counts for Barack Obama and Hillary Clinton are very similar and the counts of statements for each category are close. Statements of these two politicians are mostly in true side of the plot. It can be seen that almost 50% of Donald Trump’s statements are labelled as lie. When comparing with the statements of Obama and Clinton, the lie ratio of Trump is nearly 5 times higher than other two politicians.
Trump’s False Statements during 2016 Elections Campaign
We will consider the number of Trump’s false statements in six week intervals starting from the date that he formally launched his presidential campaign to the 2016 Elections date. We assume that the number of lies will increase as the election date approaches. We will use Spearman and Pearson correlation tests to find out if the number of lies increases with time.

| Pearson | Spearman | |
|---|---|---|
| Correlation | 0.877 | 0.906 |
| p-value | 8.06e-05 | 1.95e-05 |
We can observe that starting from July 2015, the number of Trump’s lies shows an increasing trend in six-week intervals. In addition to the line plot, Pearson and Spearman correlation tests give a very high correlation coefficient. We select the significance level as 0.05 for correlation tests. As the p-values of tests are lower than the significance level, we can say that there is a significant correlation between date and number of lies told by Donald Trump.
Quarrel Network
We will present the liars and the people who are affected by those lies in a network. We would like to present a connected graph, so we will find the list of people who included at least a person in that list in their lies. Network can be seen below. Edges are directed and the arrow points to the person who is included in the lies of source person. As the number of lies increases, the edges thicken. You can click the person to see the people that the current person include in his/her lies. You can see the biography of the person by hovering the node.
We can observe that a lot of politicians include Barack Obama in their lies. It is convenient with the results that we found out in Q2. Also, we can see that the thickest edge is the one which points to Hillary Clinton from Donald Trump. As a result, we can infer that Donald Trump attacks Hillary Clinton a lot.
Images:
-
Scott Walker speaking at the 2017 CPAC in National Harbor, Maryland.” by Greg Skidmore is licensed under CC BY-SA 3.0
-
Other images are in public domain and taken from Wikimedia Commons.
Lie Predictor
In order to predict if a given statement is a lie or not, we needed to extract features for each statement. We used pre-trained Glove vectors to represent words which are trained on 2 billion tweets and having a dimension of 200.[2]
Our dataset contains counts for labels: barely true counts, false counts, half true counts, mostly true counts, pants on fire counts. These counts are collected from PolitiFact.com. We considered false and pants on fire counts as lies. So, if for a statement the sum of false and pants on fire counts are higher than the sum of the rest of the counts for the given statement, we labeled this statement as lie. Now, our prediction task is a binary classification task.
In preprocessing step, we remove punctuations, lemmatize words, filter out out-of-vocabulary words. Returned ‘statement_set’ by the function is a list of word list of each statement.
In this section, we compared the classification results of three models: Logistic Regression, SVM and LSTM.
Logistic Regression
Each word is represented by a Glove vector of 200 dimensions. Since number of words in each statement varies, the average vector of each statement is calculated to be used in logistic regression and SVM models.
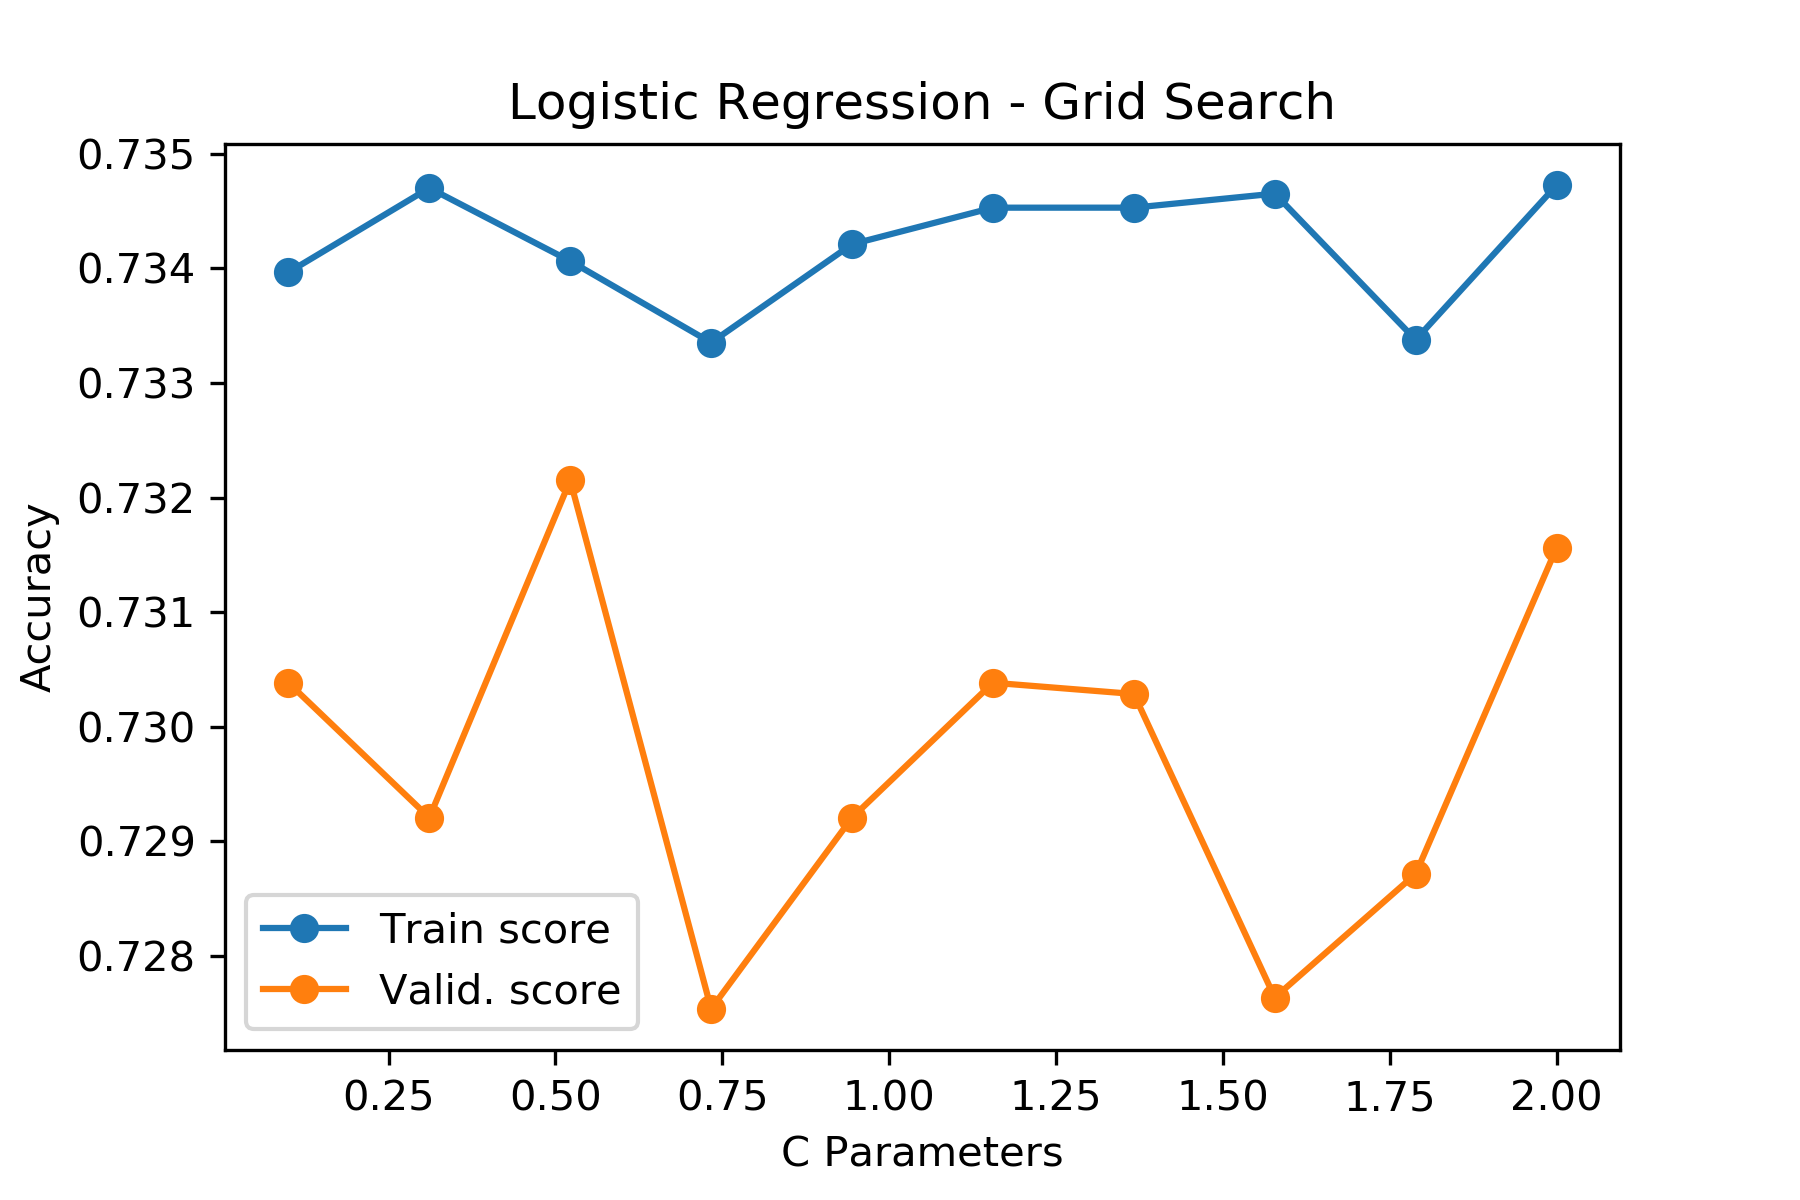
We performed grid search to find the optimal C parameter for logistic regression. Additionally, our grid search model performs cross validation with 5-folds.
SVM
We performed grid search to find the optimal C and gamma parameters for our SVM model. Additionally, our grid search model performs cross validation with 5-folds.
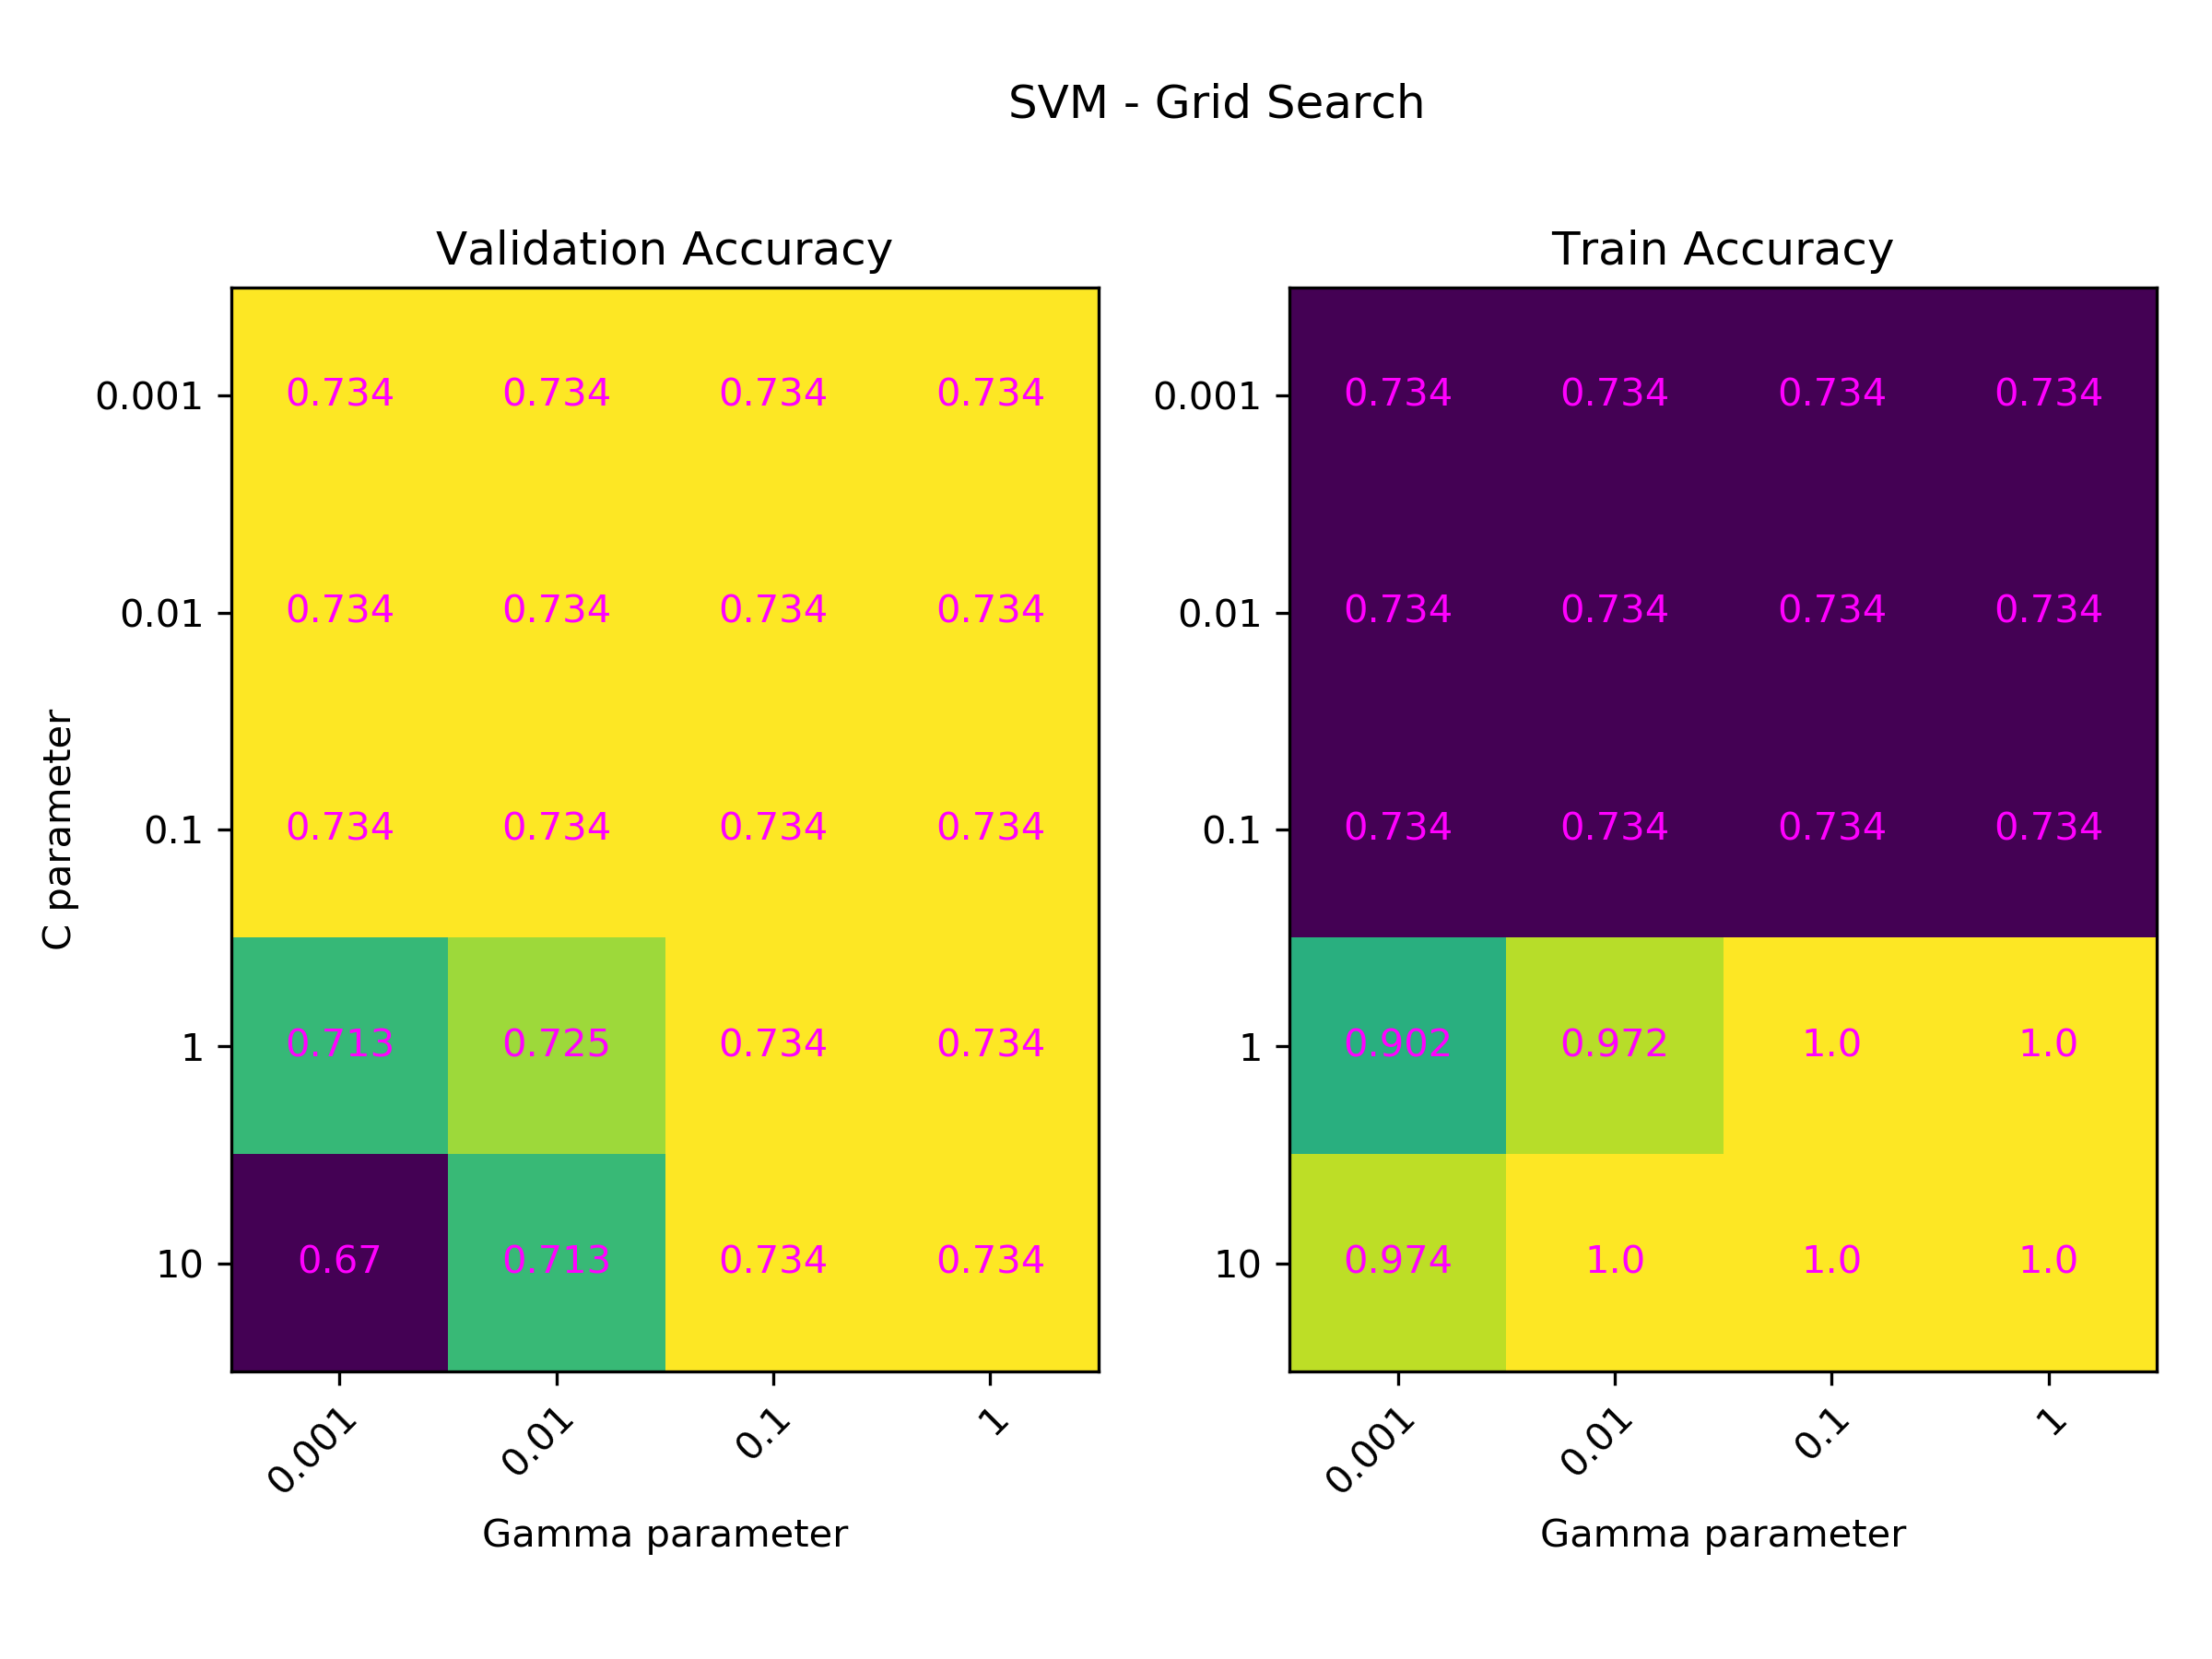
Change in accuracy of models with different C and gamma values are shown via heat map. Change in gamma parameter does not have a considerable effect on the results. However, as the C parameter gets higher, overfitting also increases.
LSTM
Keras requires an Embedding Layer to be able to create neural network models on text data. An embedding layer is the input layer where each word is integer encoded. We created unique integers for each word in our training corpus by using Tokenizer API. We initialize the embedding layer with ‘embedding_matrix’ which maps keys with weights from Glove model.
We also use padding so that each sample has the same size.
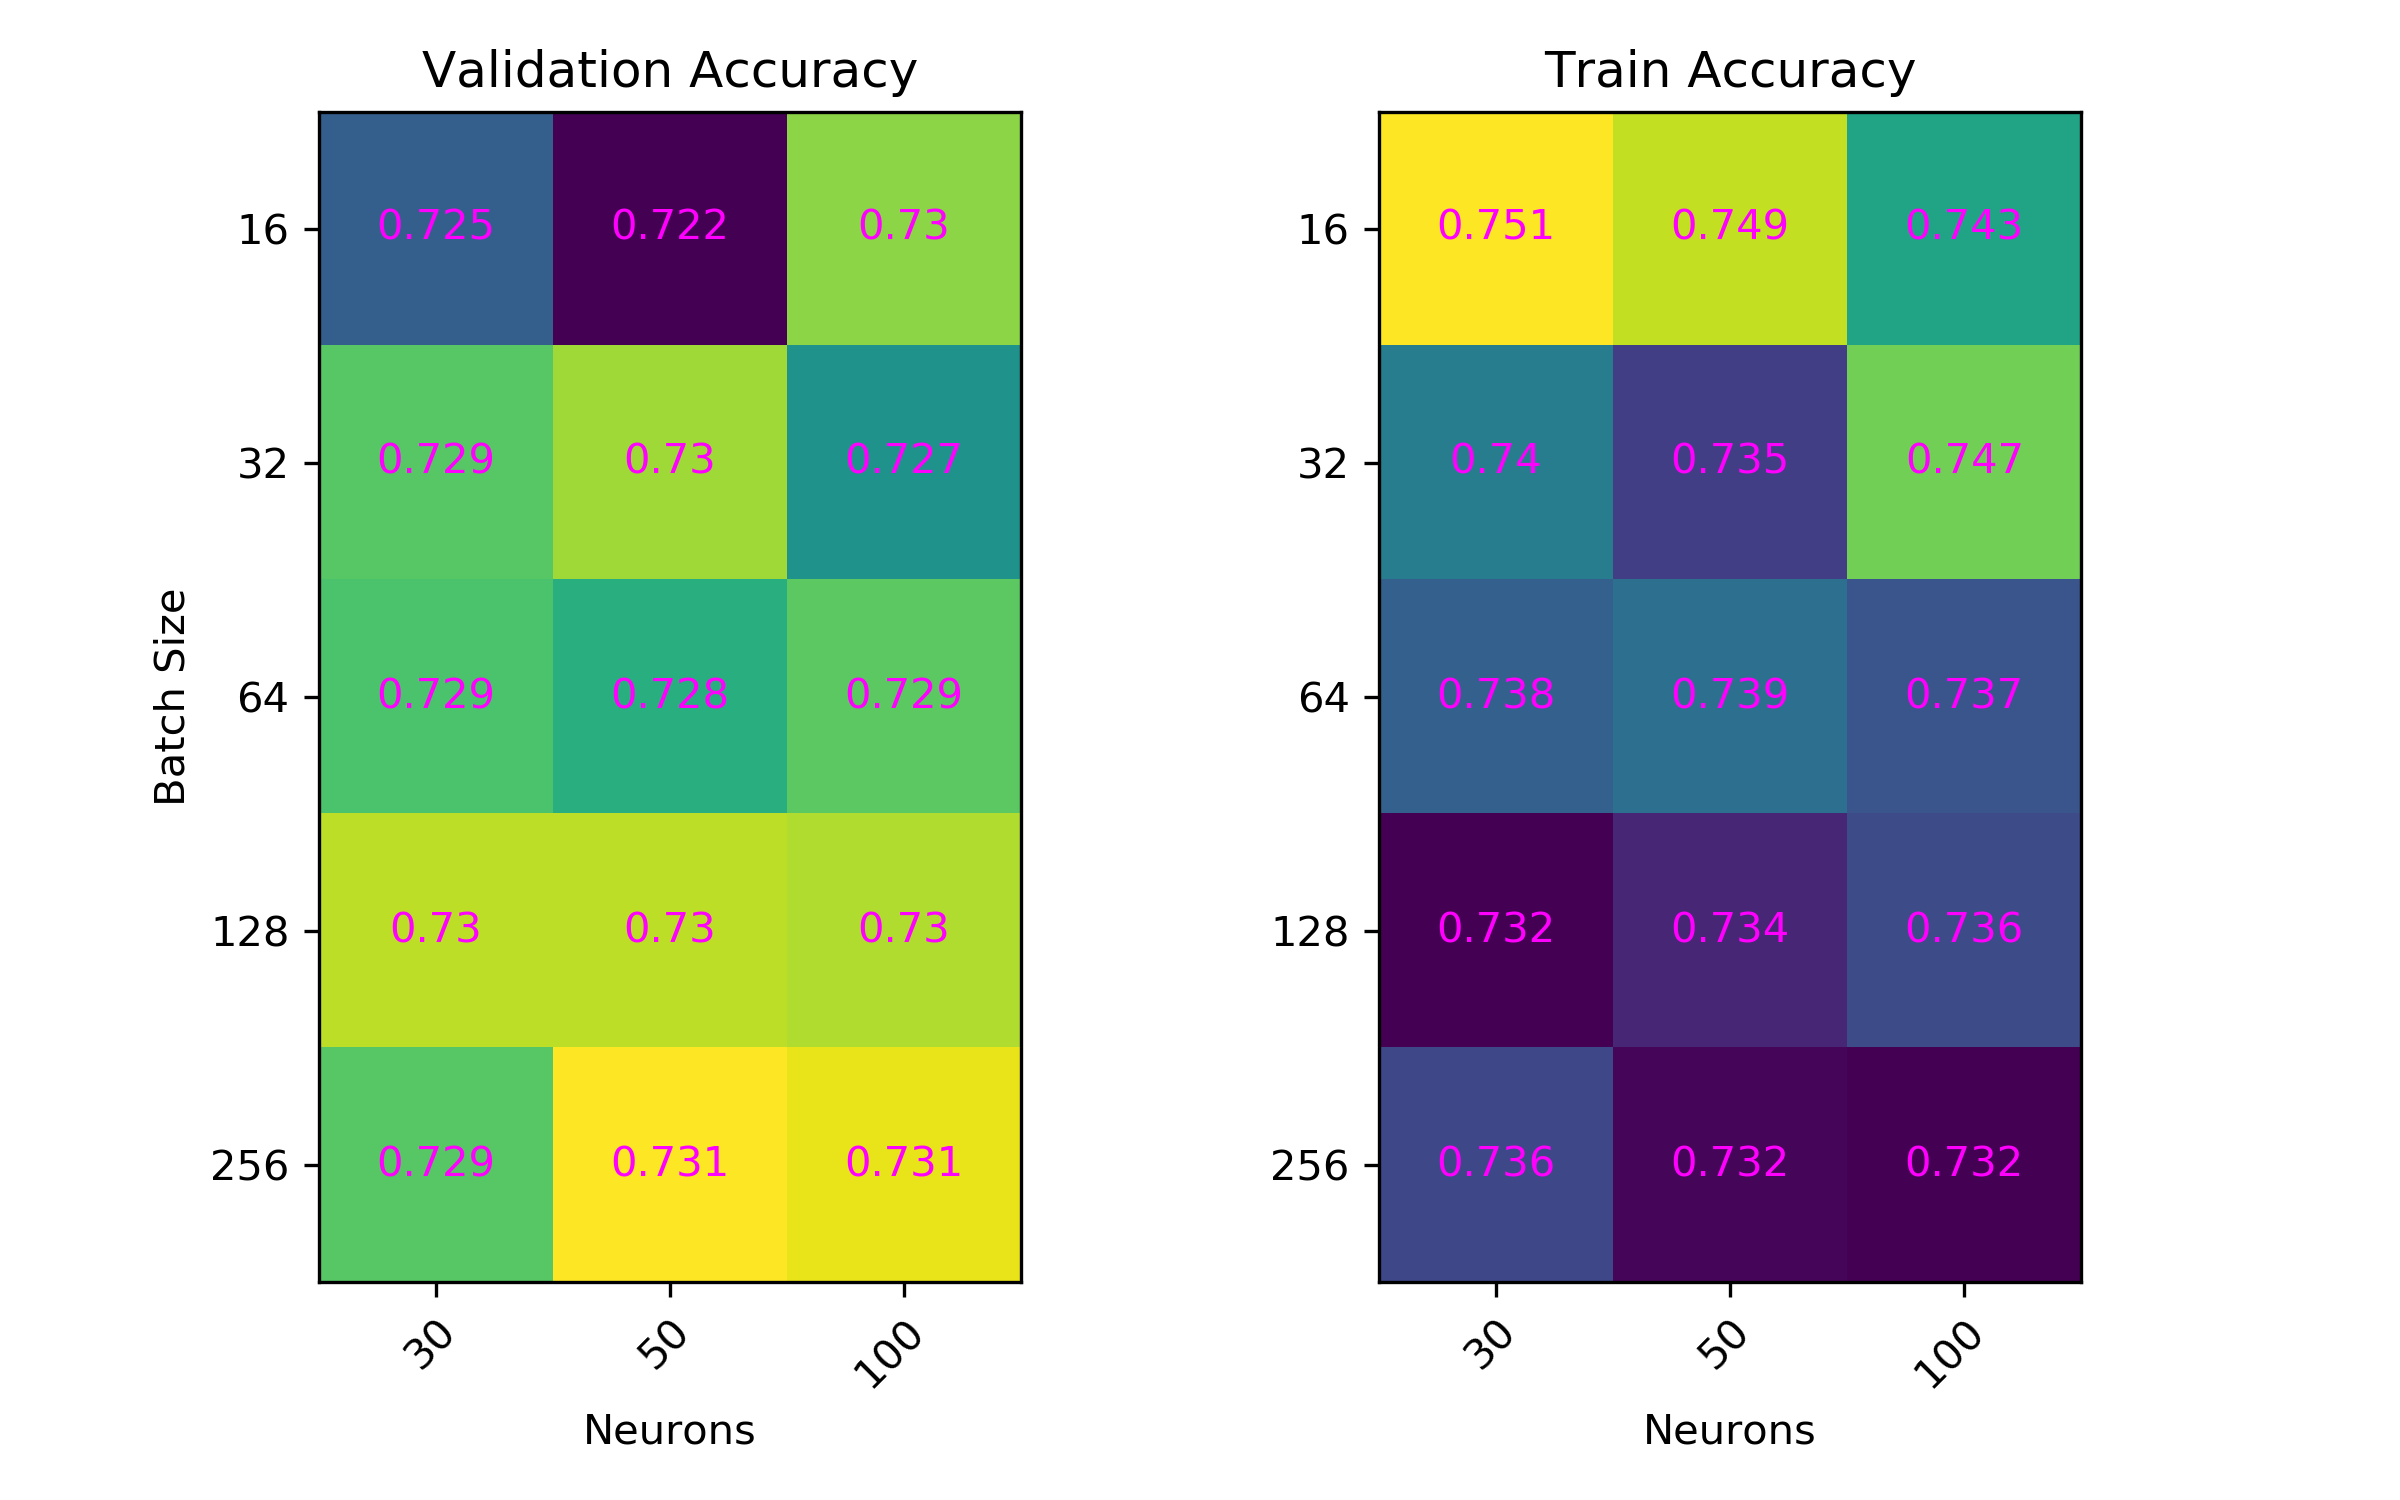
Change in accuracy of models with different batch size and number of neurons values are shown via heat map.
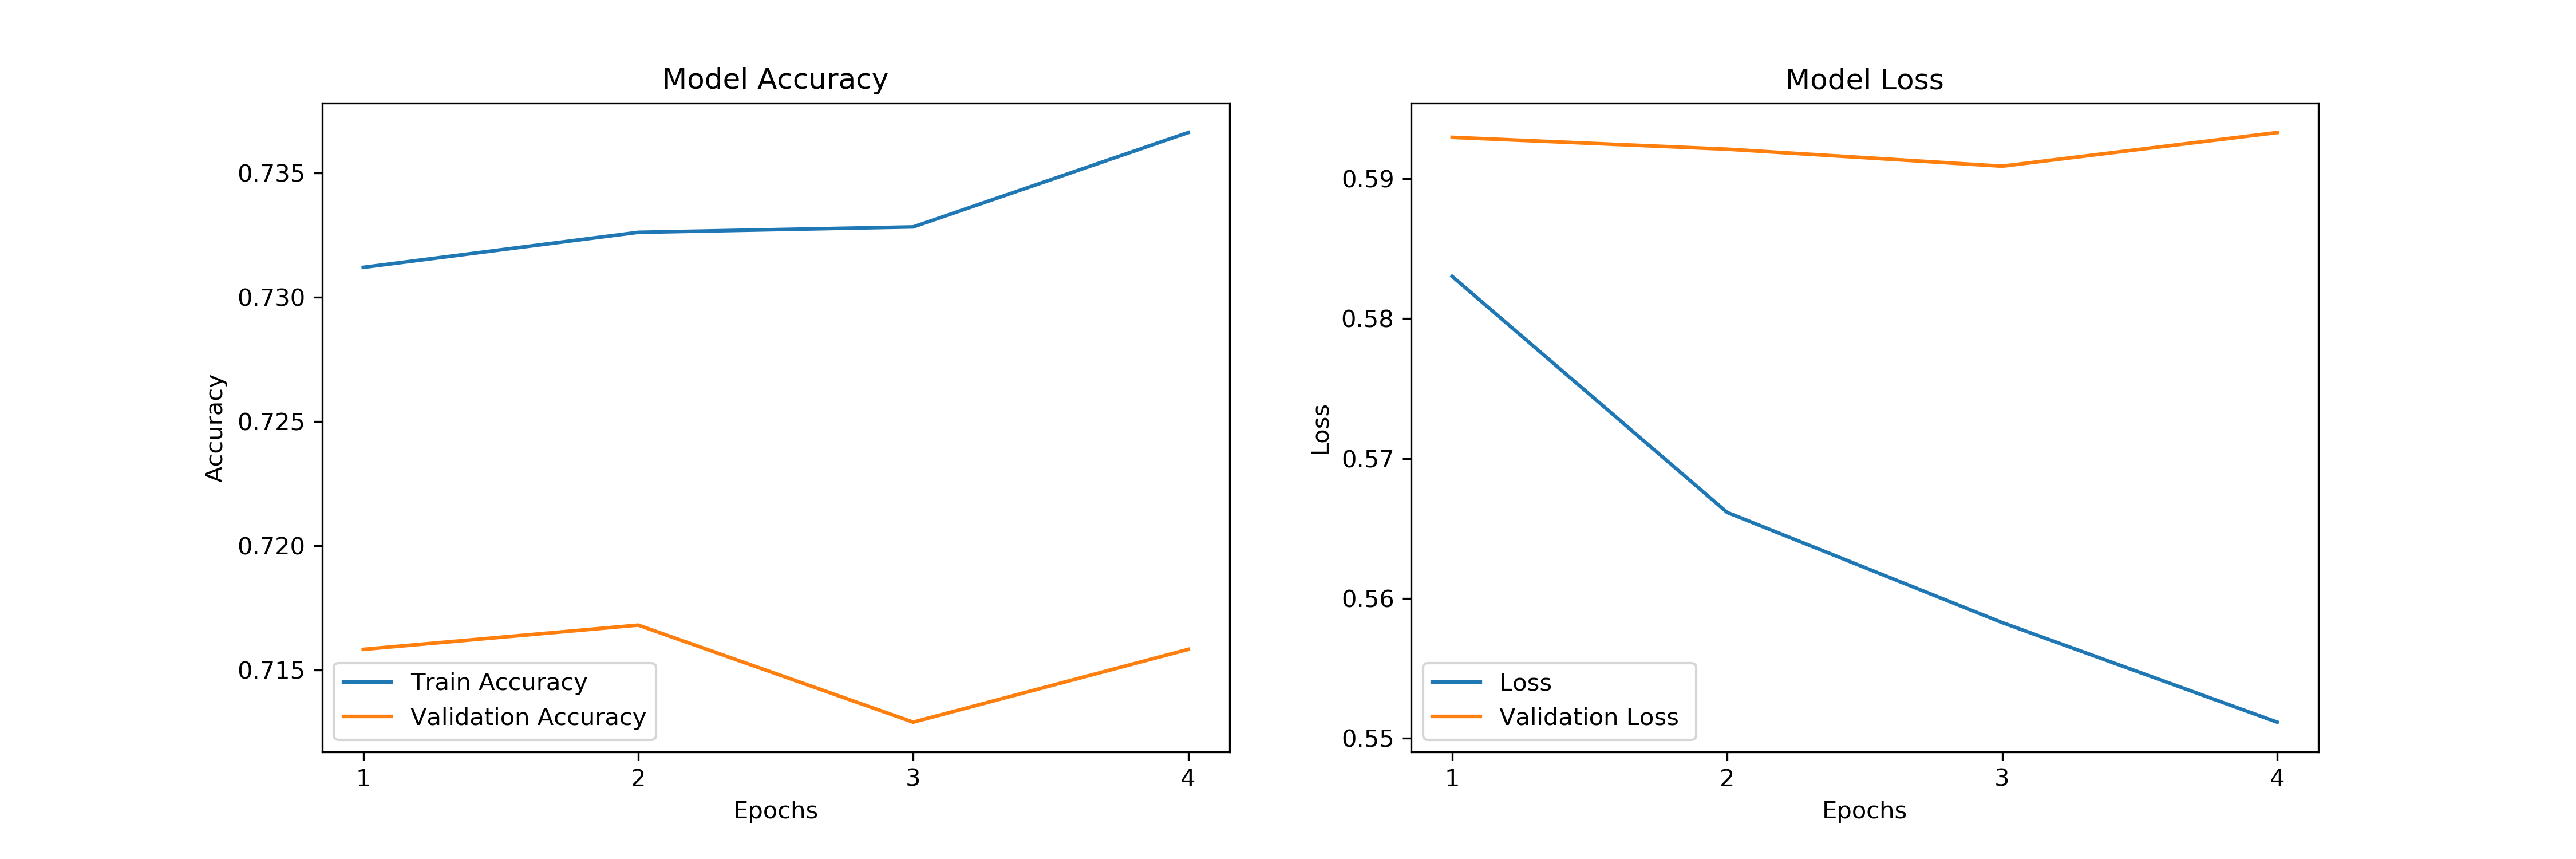
Comparison of Predictor Models on Test Set
| Models | Accuracy |
|---|---|
| LSTM | 0.739 |
| SVM | 0.738 |
| Logistic Regression | 0.731 |
Since our dataset is small, LSTM performed worse than we expected. However, the best test score belongs to LSTM, where SVM is the second and Logistic Regression is the last. The difference between accuracy values are very small, so we cannot say that LSTM significantly improve our results.
Conclusion
In this project, we aimed to present an analysis on false statements of US politicians. We also consider the effects of these false statements on society with several research questions. Consequently, we present the hidden dynamics of false statements using some statistical and natural language processing tools. Moreover, we created a classifier to predict if a statement is lie or true using embedding word vectors. The idea of predicting false statements was based on the paper which includes the dataset [1].
References
[1] Wang, W.Y. (2017). “Liar, Liar Pants on Fire”: A New Benchmark Dataset for Fake News Detection. http://arxiv.org/abs/1705.00648
[2] Jeffrey Pennington, Richard Socher, and Christopher D. Manning. 2014. GloVe: Global Vectors for Word Representation