We have come a long way since the public screening of ten of Lumière brothers' short films in Paris on 28 December 1895 to Avatar, a movie whose cost of development reached more than 200 million dollars and recorded nearly 2 billion dollars in gross, the highest of all-time. From a historical point of view, movies have acted as a reflection of our society and our culture. During all this time, scripts have remained the base stone to a movie. What script must one write for a movie to prosper? We have data spanning nearly 100 years with over 4,000 movies to try to solve this puzzle. Using the OpenSubtitles dataset and the IMDb dataset to analyze movies' scripts and measure their popularity we hope to provide a better insight to what makes a good and a bad movie.
Soon after the invention of film, efforts were made to convey dialogue of actors to the audience. Subtitles first took the form of intertitles: texts drawn or printed on paper, filmed and placed between sequences of the film. By the 1930s, around the time color television became prevalent, subtitles shown on the screen at the same time as the moving picture were finally patented. Filmmakers would stamp subtitles directly onto film strips, but this was already a step toward digitized subtitles in the future. It wasn't until the late 1980s when advances in technology made it possible for entire subtitle systems to be downloaded onto a computer. Nowadays, closed captioning and subtitling allows English-language movies to be enjoyed in many countries across the world, and for English-speaking countries to enjoy films made in other languages. Moreover, independently made films have increased in popularity in the past couple decades and platforms like YouTube allow users to add subtitles to their video content using machine-generated automatic captions. Our data reflects the evolution of subtitles. Before diving into our analysis, we give a short overview of our dataset to expose readers to some of the challenges we were confronted to. Please note that we avoid implementation details and can refer to our source code for a more detailed analysis.
The OpenSubtitles2018 dataset consists of 34.5 GB of data. For details on how data was gathered see OpenSubtitles2016: Extracting Large Parallel Corpora from Movie and TV Subtitles. For the purposes of our analysis, we drop TV show episodes, movies with invalid IMDb identifiers and superfluous metadata.
IMDb is the largest online database of information related to films including cast, production crew and personnel biographies, plot summaries, trivia, and fan reviews and ratings. To measure a movie's popularity we retrieve a movie's average rating provided on the IMDb dataset page.
In order to build a predictor, we follow the following methodology in our analysis.
After the data cleaning we have 4,127 movie subtitles distributed across time in the following way.
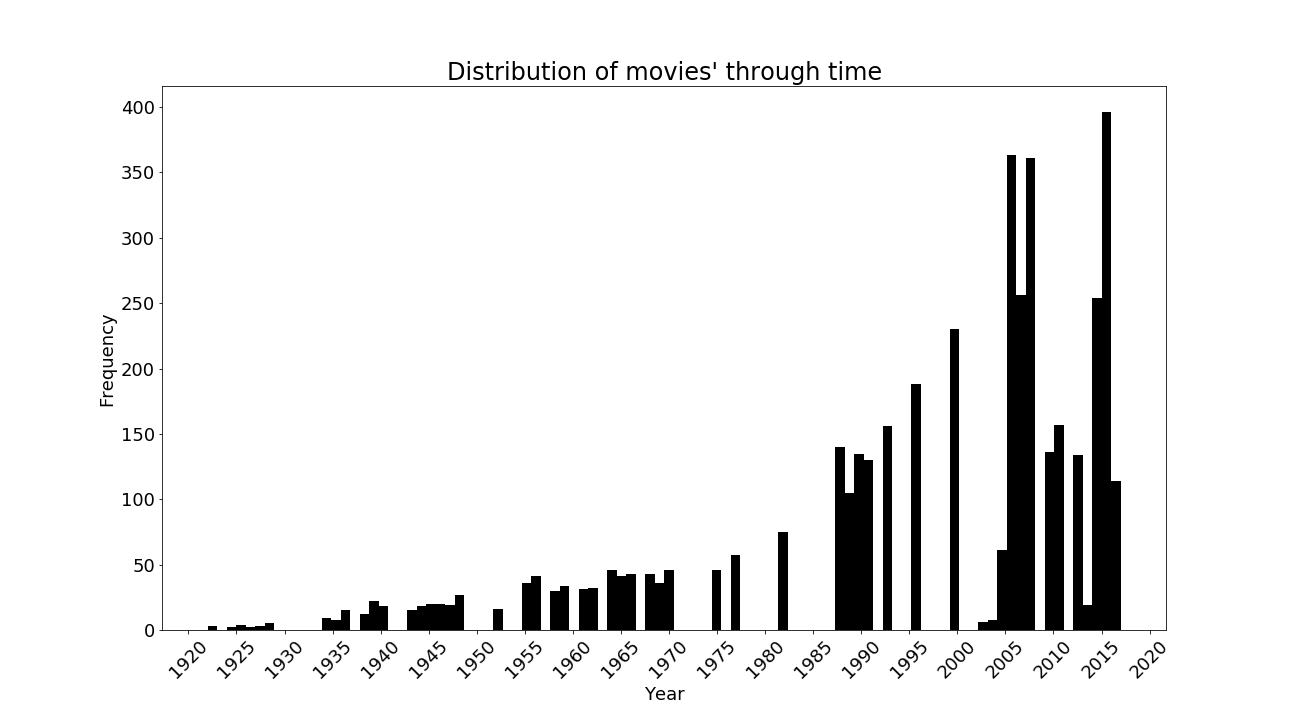
We see from our plot that our data is not evenly distributed. Most of our subtitles come from recent films, thus making an accurate time analysis complicated. Notice how incomplete our dataset is. Certain years have no movies as we see significant gaps in the 1970s and 1980s. The following table also confirms that more than half of our data points are in the 2000s and that we have very few movies before 1960.
Period | Count | Average Rating |
---|---|---|
1910-1959 | 379 | 7.58 |
1960-1999 | 1350 | 6.83 |
2000s | 2495 | 6.47 |
It also seems that recent movies tend to have a worse average rating, while the best films are the older ones. We attribute this to the idea that more data has been collected in recent years, regardless of whether movies are good or bad, while subtitles available for old movies are primarily for good movies. Due to the uneven distribution of movies across time, we believe it would be difficult to take time as a good feature to predict the rating. Intuitively, the release year of a movie has little to do with its rating.
Different movie genres typically have different characteristics and so we explore statistical features of genres. We explore the distribution of the different genres in our dataset.
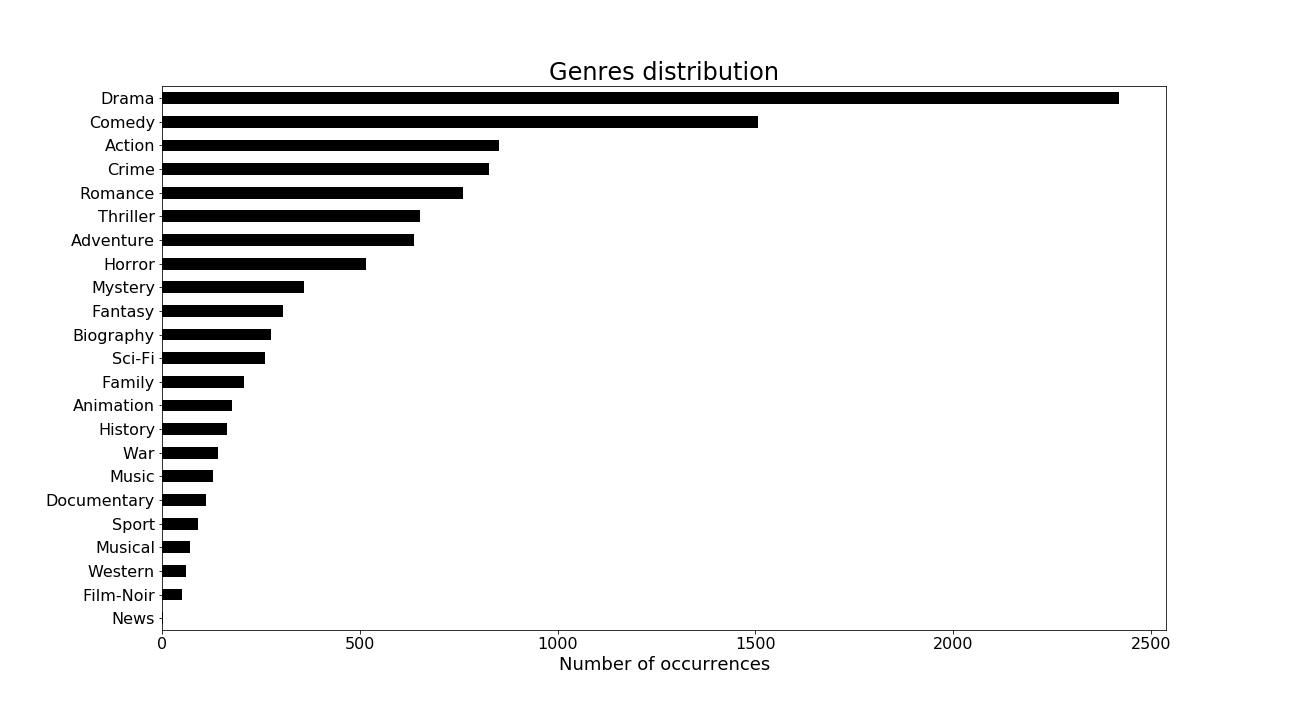
Drama is the most frequent genre in our dataset. Since we saw that our dataset had years with no subtitles data and was thus fairly incomplete, we compare the average IMDb rating of our movie's subtitles dataset for the 10 most frequent genres to the corresponding genre average rating on the whole IMDb database.
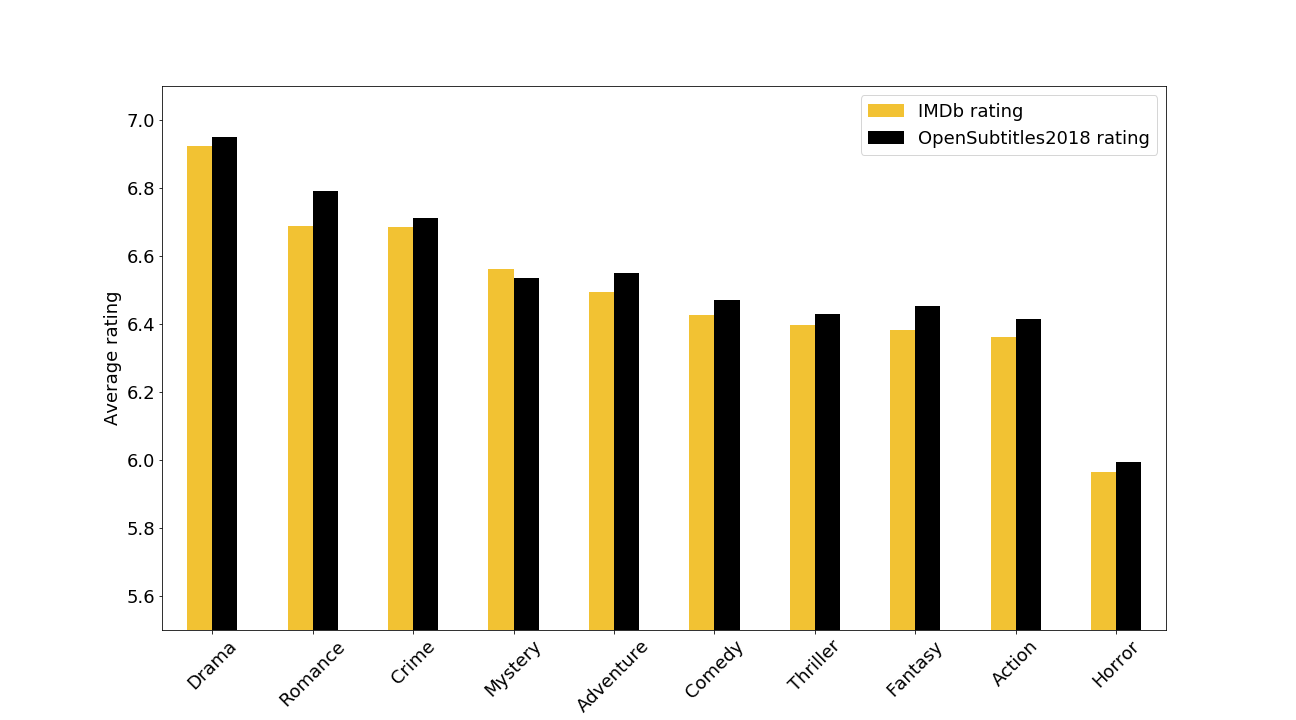
We see that for each genre there isn't much difference between the average IMDb rating and the OpenSubtitles2018 rating. Despite the incompleteness of our dataset across time, each genre's average IMDb rating in our dataset is fairly representative of the genre's IMDb rating. We also notice the wide gap between Drama movies' and Horror movies' average rating. We can therefore hypothesize that a movie's genre has an influence on its average rating.
Mean | Std Dev | Min | 25% | 50% | 75% | Max |
---|---|---|---|---|---|---|
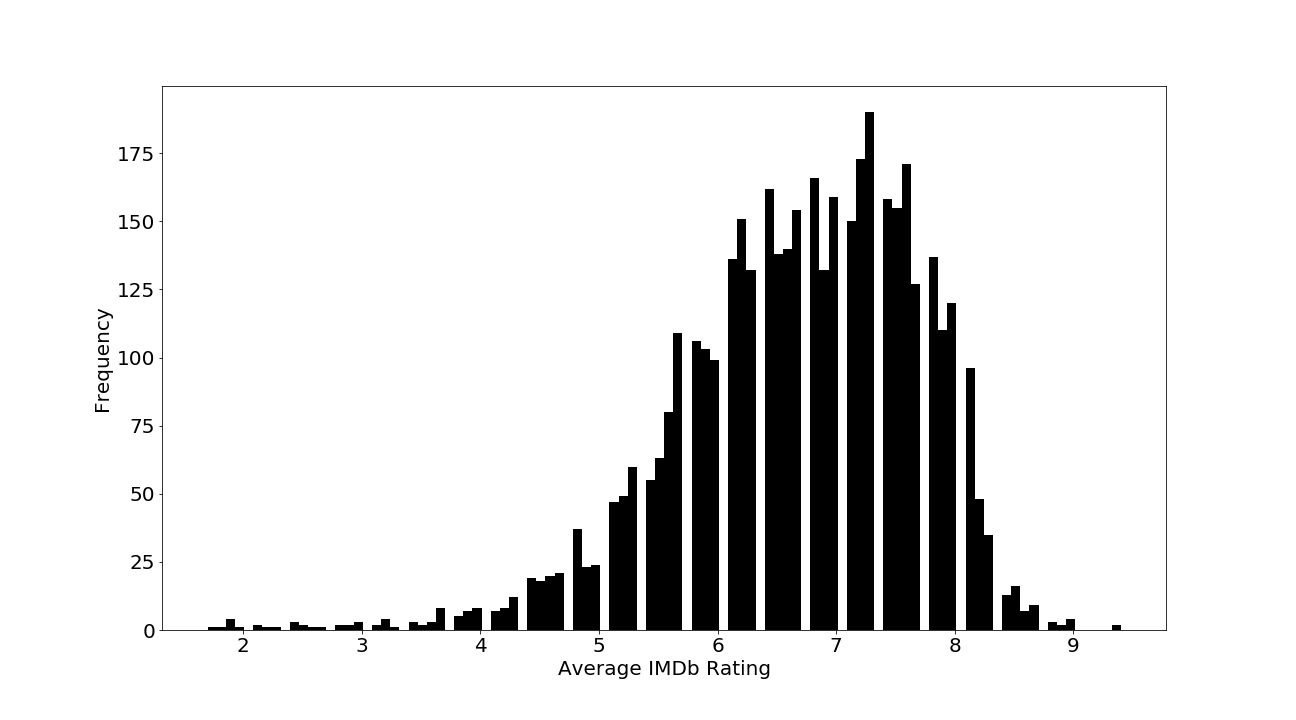
6.682667 | 1.027169 | 1.7 | 6.1 | 6.8 | 7.4 | 9.4 |
This graph resembles a normal distribution left-skewed and shows
that a good movie would be a movie that has a rating higher
than 6.7.
We define two classes with approximately the same number
of movies: good movies and bad movies.
We consider good movies to be movies with average IMDb rating
above 8 and bad movies to be movies with average IMDb
rating below 5.2. We get two classes with 353 and 355
movies respectively.
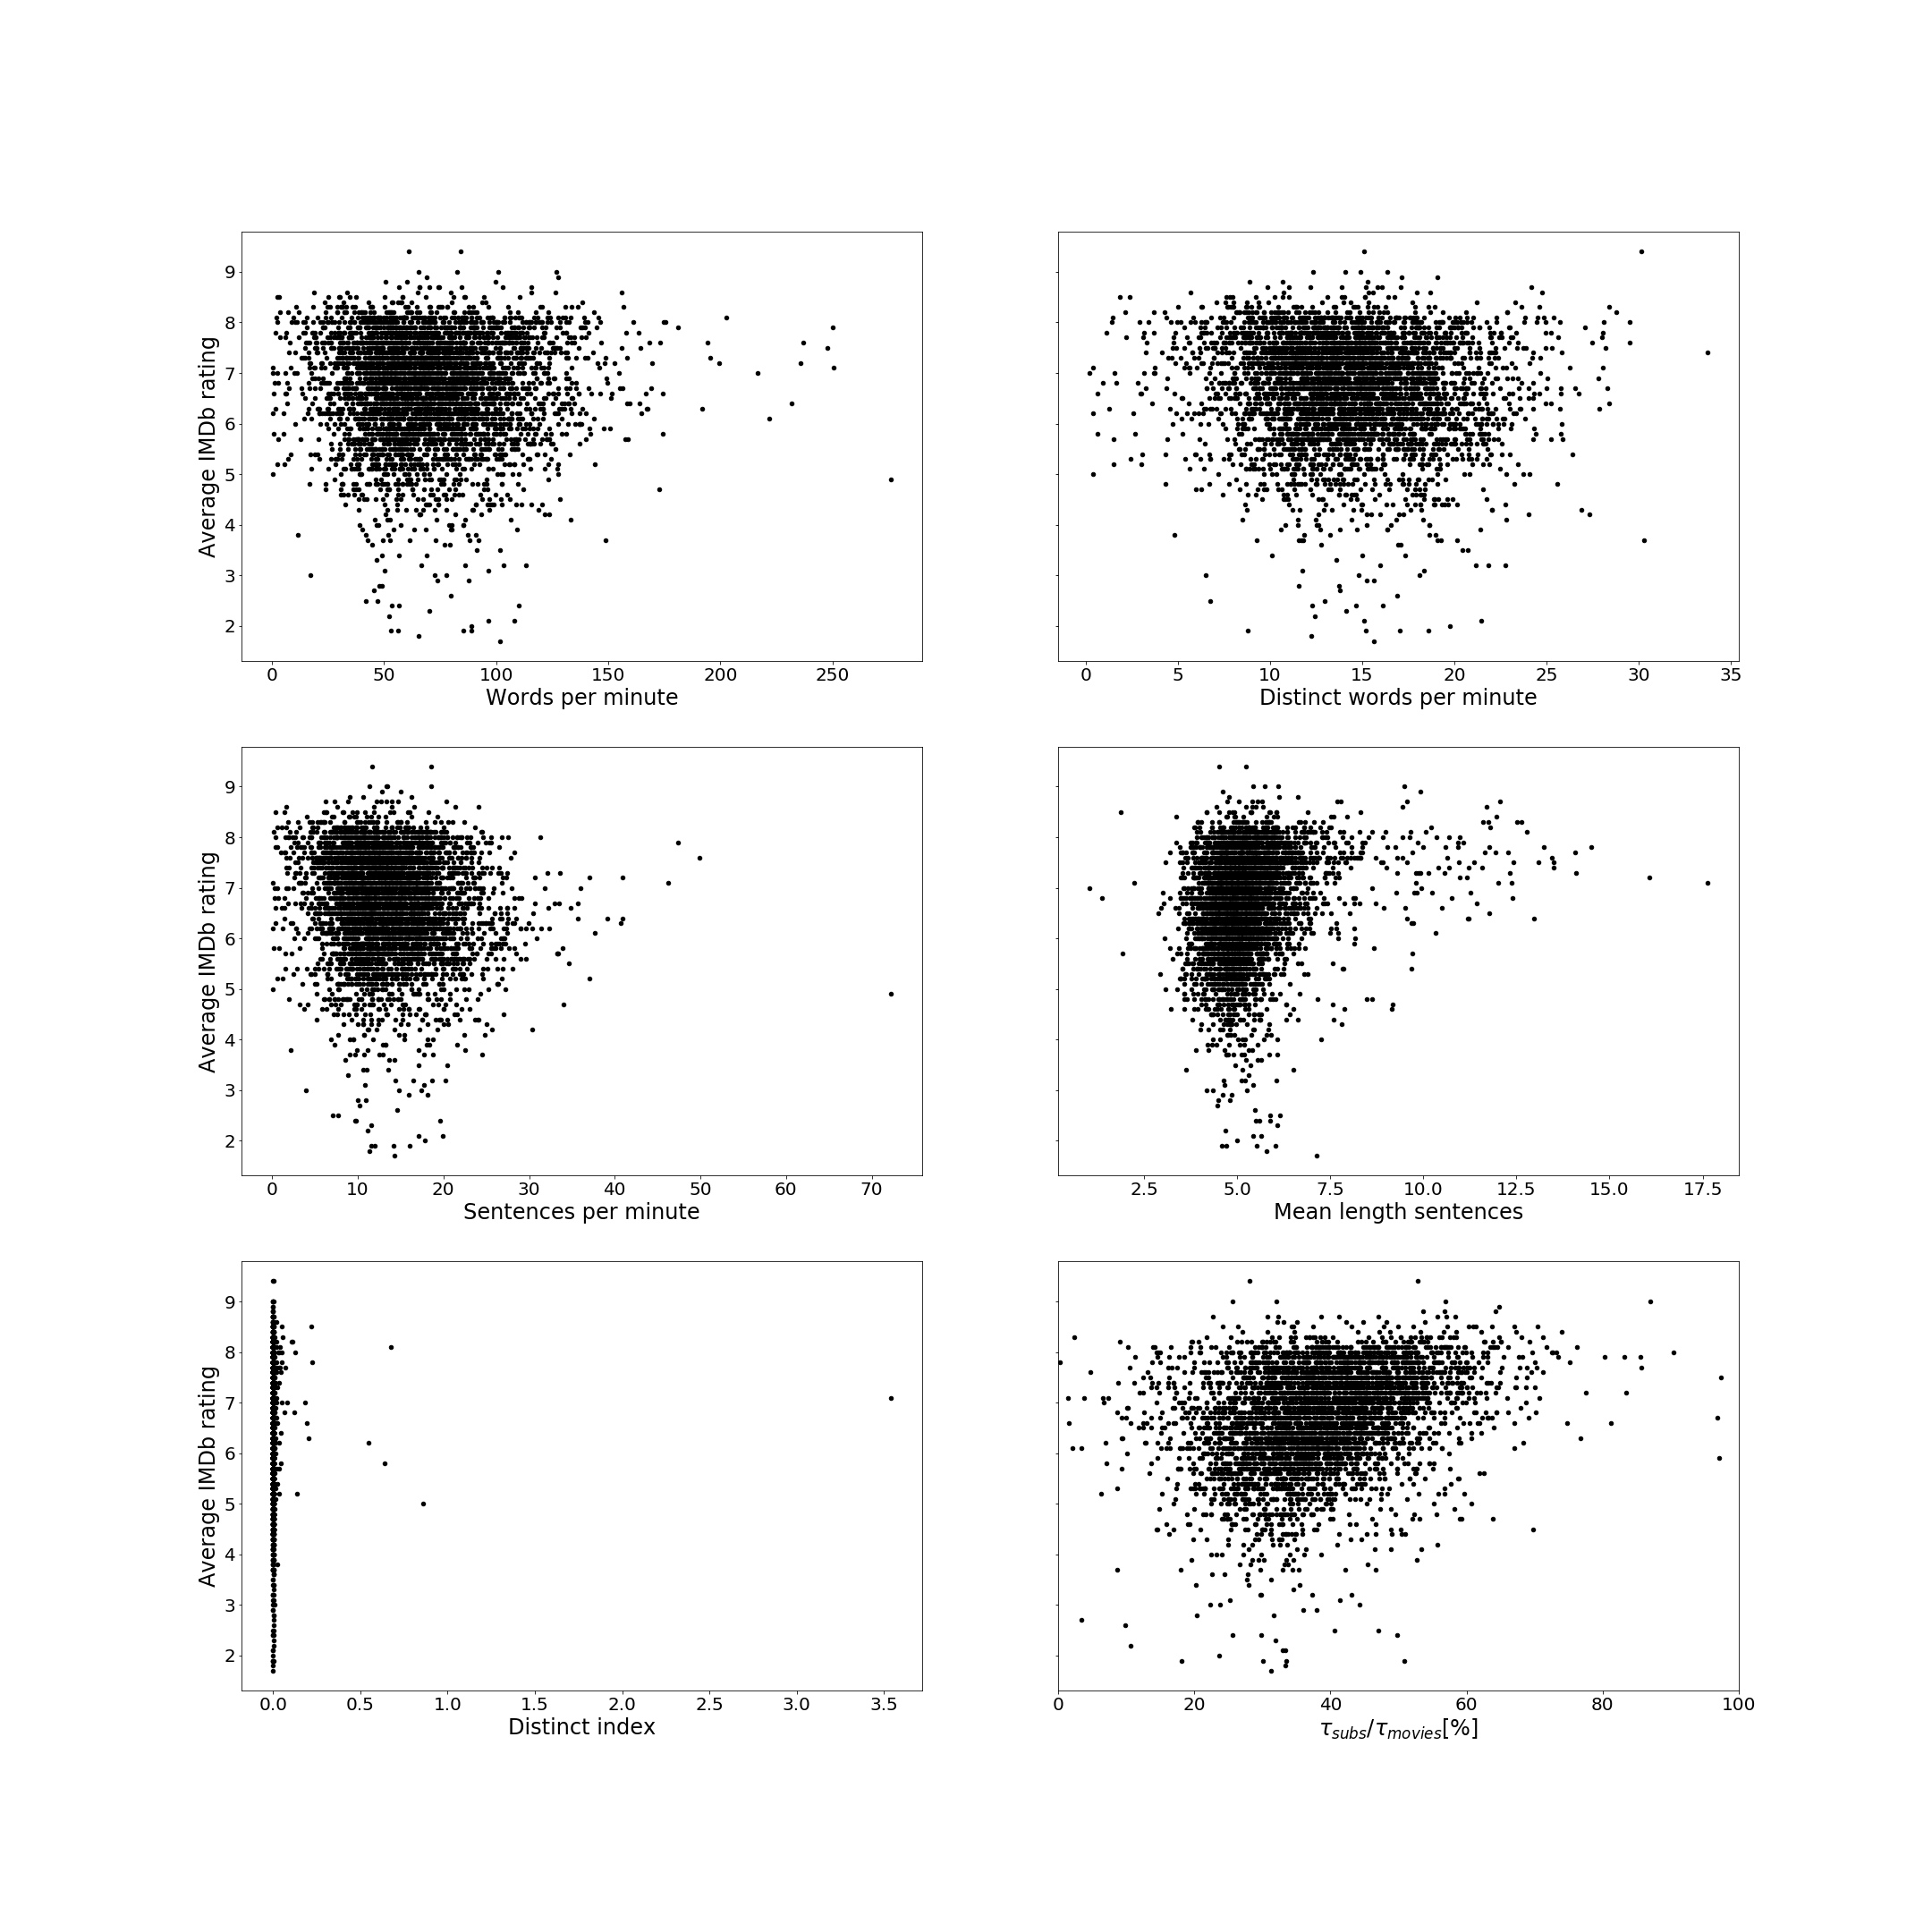
Raw features are extracted from the subtitles and the metadata:
We plot scatter plots of each individual feature against movie's average IMDb rating and compute their Pearson correlation coefficient.
Feature | Correlation |
---|---|
Words per minute | 0.006 |
Distinct words per minute | -0.071 |
Sentences per minute | -0.111 |
Mean length sentences | 0.198 |
Subtitles to movie duration | 0.298 |
Distinct Index | -0.002 |
We see that Mean length sentences and Subtitles to movie duration have a weak positive correlation with the average rating. Sentences per minute has a weak negative correlation. Words per minute, Distinct index and Distinct words per minute have no real correlation. More precisely, we can see on the scatter plot that a movie with a high value in Mean length sentences or Subtitles to movie duration tends to have a higher IMDb rating. But a low value in Mean length sentences or Subtitles to movie duration have no real significance.
We also plot histograms of the good movies and bad movies classes for each individual feature.
Again, Mean length sentences and Subtitles to movie duration show the strongest distinction between the two classes. While Sentences per minute, Words per minute, Distinct index and Distinct words per minute have no real distinction between the two classes.
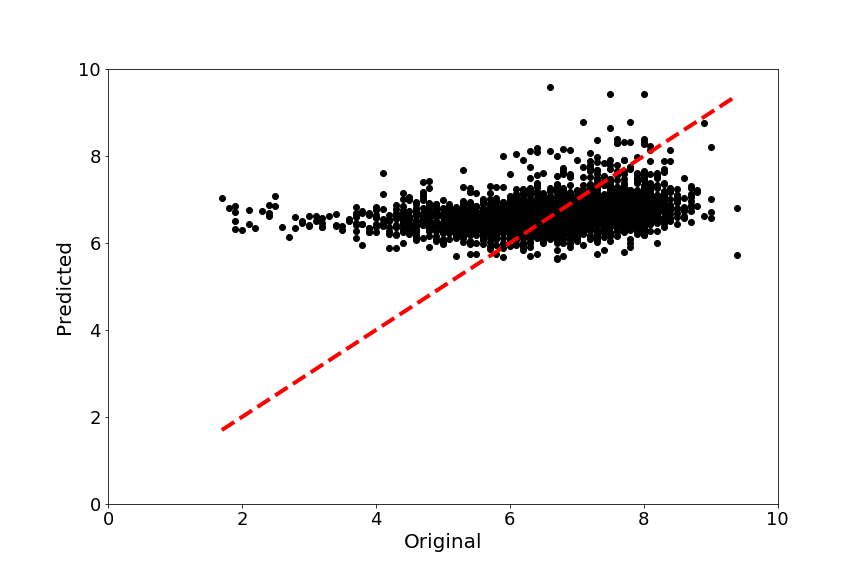
We use all our features to build a predictor and hope that our our best features, namely Mean length sentences and Subtitles to movie duration, will provide some insight. The red line represents the function i.e. the perfect predictor.
We see that movies with a high IMDb rating are more predictable than movies with a low IMDB rating. As we see in the scatter plots, Mean length sentences and Subtitles to movie duration have no distinct values that appear only for bad films. On the other hand, movies with high values in Mean length sentences or Subtitles to movie duration tend to have a better rating. This explain why our predictor fails to predict bad movies, but does a better job in predicting good movies. All in all, our features don't seem to be enough to predict the final rating of a movie.
As our linear regression didn't give us satisfying results in the prediction of movies' average IMDb rating, we explore NLP tools to try to get further insight into what makes a good and a bad movie.
We implement a sentiment analysis to see if a movie's general sentiment has an influence on the final rating. We analyze all the sentences of a movie and extract the positive and negative sentiment of each sentence. For both positive and negative sentiments, we divide the total sentiment by the number of sentences and use this as a feature to compare movies. We focus on the 100 best rated movies and 100 worst rated movies.
We see that the best movies have less of a positive sentiment than the worst movies, but the negative sentiment is more or less equal for both classes. We interpret this as follows: many sad scenes in a movie do not imply a high rating of the movie, but on the other hand, too many positive and joyful scenes generally make the movie worse.
We come up with recommendations of topics to use and topics to avoid for certain genres by analyzing the topics present in the best and worst movies classes defined earlier. More precisely, we retrieve set of words that characterize recurrent topics in good or bad movies for a given genre using Latent Dirichlet allocation. We then label topics manually, although more advanced techniques using Wikipedia pages (see Labelling topics using unsupervised graph-based methods) or search engines (see Automatic labelling of topic models) also exist.
The number of considered movies for the detection of top 3 topics is written next to the genre in the heading. Our topic detection works best with a larger number of movies, since we can attribute greater confidence in the topics and words detected. The manual labelling, however, can become more difficult as the words detected can be of a different and more diverse nature.
Good drama movies indicate crime, justice, and family as topics, while bad ones indicate marriage and police as topics. Marriage is very similar to family, as is police with crime. According to our data, good and bad drama movies are subtly different but if any movie writers are reading this, please follow this recommendation at your own risk!
"Good" comedies often deal with the topics of government, war, religion and morality. Spoof comedies or movies set during the middle ages or renaissance, on the other hand, are not recommended. If the movie talks about holidays, it should be about family, and avoid the sex and teen drama topics.
Justice is a topic that is often present in "good" action movies, but less in bad action movies. "Good" and "bad" action movies often focus on war, police, the army. We noticed, however, that "good" action movies tend to be more realistic, while "bad" action movies incorporate elements of science-fiction like for instance alien invasion. Moreover, romance is not as dominant in the "good" movies set, as it is in the "bad" movies set.
"Good" romantic movie have a high occurrence of war-related topics and stories that involve some "goodbye" theme. We also see in the bag of words retrieved the topics of a young, college and romance. Moreover, movies that involve marital affairs also tend to popular. Finally, romance movies should avoid the holidays topic and having too much sex, particularly if vulgar with words such as b*tch or f*ck.
We provide further down the pyLDAvis visualizer, using a predefined "good" comedy class.
In order to predict the average IMDb rating, we tried to extract statistical features from the movie subtitles. Unfortunately, this method did not lead to great results as very few features were correlated with the average IMDb rating. We then tried to get a sentiment score using NLP tools, but this did not provide us with much further insight into what makes a good movie. Finally, we implemented a topic detection algorithm on our dataset to provide topic recommendations depending on the genre. We may not have been able to provide a recipe to a good movie, but the topic detection did provide us with further ideas that could be implemented in a movie rating predictor. Had we had more time, we would have improved our predictor by incorporating categorical features such as genres and topics. In any case, our work showed us that a movie is more complex than its subtitles' structure, sentiment and topics. Movies combine sound, text and images to convey deeper ideas and emotions than those in subtitles. One would have to dig deeper in the subtitles to obtain a more accurate statistical representation of a good movie.